Cryptocurrency experts are advising traders to remain vigilant and potentially reduce their long positions if Bitcoin (CRYPTO: BTC) trades below a critical support level amid conflicting signals in the broader economic landscape.
What Happened: According to the latest 10x Research report, the crucial level to watch is the 21-week moving average, currently sitting at $60,918.
This price point coincides with a minor support level of $60,600, which previously acted as resistance in August and September.
“While the buy-and-hold strategy has historically been effective for U.S. stock indices and Bitcoin, there’s no guarantee it will remain so,” caution analysts at 10x.
This comes in light of conflicting market data, where faster-moving trends sometimes paint a different picture from slower macroeconomic indicators.
Bitcoin’s recent inability to surpass $66,000, which aligns with a descending resistance line, has added to market caution.
“The liquidity cycle has yet to materialize fully,” according to 10x analysts, a sentiment echoed by the flat ISM Manufacturing Index, which stayed at 47.2 this month, contrary to expectations of a sharper decline.
Another critical point revolves around the ISM’s impact on Bitcoin cycles.
“The ISM continues to signal downside risk for Bitcoin. Years of experience and rigorous backtesting have shown the ISM’s significance across multiple economic indicators and assets,” the analysts state.
They highlight that until the ISM demonstrates a consistent upward trend, the market may struggle to attract liquidity inflows.
Despite these concerns, there remains optimism for a potential upside.
Analysts still believe that Bitcoin could see gains in Q4, provided it holds above the $60,918 mark.
“The $60,918 level is closely aligned with the $60,600 level, which has acted as resistance multiple times in August and September,” analysts note.
However, they urge traders to be prepared: “If Bitcoin drops below the 21-week moving average of $60,918, traders should implement a solid risk management framework.”
What’s Next: For investors looking to learn more about the evolving dynamics of digital assets, the upcoming Benzinga’s Future of Digital Assets event on Nov. 19 offers valuable insights into the crypto landscape.
Media giant The Walt Disney Company (NYSE:DIS) scored a box office hit with “Inside Out 2,” a movie that could also help the company’s streaming segment for the fourth quarter.
What Happened: When Disney reports fourth-quarter financial results, which are currently expected in November, the company might mention the success of its hit sequel “Inside Out 2” many times.
The movie was released in theaters on June 14, which was in the company’s third quarter, but a good portion of the box office success will come in the fourth-quarter financial results.
“Inside Out 2” also recently premiered on Disney+ on Sept. 25, which is part of the company’s fourth quarter. The movie’s streaming premiere may help Disney+ subscriber numbers trend up in the quarter.
The movie had 30.5 million views in its first five days of availability on Disney+, as reported by Variety. This marks the biggest film premiere on Disney+ in 2024 and the biggest premiere for a theatrical film since 2021 for Disney (“Encanto”).
“Inside Out 2” also had its biggest premiere on Disney+ in the EMEA (Europe, the Middle East and Africa) and Latin America regions.
Why It’s Important: The film’s success on Disney+ adds to its successful theatrical run, which saw it become the highest-grossing animated film of all time.
The film grossed $653 million domestically and $1.69 billion worldwide, ranking first in both markets, as reported by BoxOfficeMojo. The movie was the first film to cross $1 billion worldwide in 2024, a milestone that Disney failed to reach in 2023.
“Inside Out 2” is only the 12th movie to pass $1 billion in international markets and the first animated film to achieve this milestone.
While the animated film was a huge hit for Disney, the media giant also experienced another blockbuster with the release of “Deadpool & Wolverine” on July 26. The superhero film grossed $631.4 million domestically and $1.33 billion worldwide, ranking second in both markets.
This gives Disney a lot to be happy about in the fourth quarter and could shine through in the quarterly results.
The media company could also highlight its future movie catalysts, which include “Deadpool & Wolverine” hitting Disney+ likely in October or November and the theatrical releases of “Moana 2” and “Mufasa: The Lion King” on Nov. 27 and Dec. 20, respectively.
DIS Price Action: Disney stock is down 1.7% to $94.48 on Tuesday, versus a 52-week trading range of $78.73 to $123.74. Disney stock is up 6% year-to-date in 2024.
Editor’s note: The headline of this story has been updated to correct the spelling of Warren Buffett’s name.
Billionaire investor and investment guru Warren Buffett once shared the thumb rule he uses when to give up on a stock and in the process explained why investors are better off than business tycoons such as Andrew Carnegie or John Rockefeller.
What Happened: “I love it when the things we buy go down,” said Buffett in a 2014 Fortune Magazine interview. He said he would get “euphoric when the stocks are down because he can buy more of something he owned. On the other hand, with their stocks, people think the stock knows more than they do, he said.
“When the stock goes down, they say the stock is telling them something… and what it’s telling me is I can get more for my money,” the Berkshire Hathaway CEO said. But they take it as a kind of referendum on themselves and make it as a “me versus stock” and say if they get back what they paid, they are going to sell the stock irrespective of what they paid, he said.
“Stock doesn’t care what you paid; you have to remember the stock doesn’t even care that you own it; you are nothing to the stock; that stock is everything to you,” Buffett said.
The only question with every stock, every day is to look into “Can I get more for my money someplace else,” he said, adding that investors get a chance to be in thousands and thousands of great businesses and their prices change all the time and so do their relative valuation.
Since an investor can make the exchange at a very low cost these days, either with low commissions or nothing, they can always shift from one business to another, Buffett said. Investors have an advantage over Carnegie, who was in the steel business or Rockefeller who was in the oil business, he said. The billionaire said these businessmen couldn’t immediately shift to something like retailing or rearrange their business empire as an investor can with the portfolio they owned. The portfolio can be rearranged at a moment’s notice with practically no cost, he said, adding that this is a huge advantage.
“There is nothing about the price action of the stock that tells you whether you should keep owning; what tells you whether you should keep owning it is what you expect the company to do in the future versus the price at which it’s selling now compared to the other opportunities of businesses you think you know equally well and make that same comparison and that’s all there is to owning stocks,” Buffett said.
Why It’s Important: Buffett swears by an investment philosophy called value investing, which advocates picking stocks that appear to be trading for less than their intrinsic or book value. He has been very successful with the strategy and the success of Berkshire is a testament to it. The company, which owns holding companies primarily in the insurance and transportation businesses, as well as portfolio stocks, is now the eighth most valued global corporation, standing head-on-head with tech stocks.
Amid the current economic uncertainty, Buffett has shown a preference for accumulating a huge cash pile. At the end of the second quarter, the company had a massive cash pile of $277 billion.
Amazon.com Inc. (NASDAQ:AMZN) reported setting new sales records during its July 2024 Prime Day event, though the company did not share many details on sales figures or growth.
Here’s a look at the data on the trending categories and brands behind Amazon’s record-breaking Prime Day 2024 event.
The Details: Amazon’s web traffic jumped by 65% on day one of Prime Day, according to data fromSimilarWeb, indicating a high level of consumer interest in the sales event.
Overall, Amazon remained the number one brand by purchases, but Apple, Inc. (NASDAQ:AAPL) climbed past Samsung to claim the number two position with 22% purchase growth. Apple’s growth was fueled by consumer searches for “Apple watch” and “airpods,” which reached the top seventh- and eighth-ranked search terms, respectively.
The Beauty & Personal Care category saw the largest purchase increase on Prime Day 2024, with sales growth of 14.8% year-over-year. COSRX was the top beauty brand by purchases, as K-Beauty trends continued to gain momentum. Koninklijke Philips NV’s (NYSE:PHG) Philips Norelco entered the top 10 beauty and personal care brands in the number nine position.
Electronics sales fell by 5.6% compared to 2023’s Prime Day event. Samsung and SonyGroup Corp. (NYSE:SONY) retained their rankings of number one and two by purchases in the category as consumers showed interest in gaming. “Gaming laptop,” “gaming pc” and “gaming monitor” search terms all ranked in the top 10 electronic keywords from Prime Day 2024.
In the Grocery & Gourmet Food brands category, coffee brands and energy drinks featured heavily in the top 10 Grocery brands. CELSIUS energy drinks by Celsius Holdings, Inc. (NASDAQ:CELH) climbed one spot to the number one position for purchases on Prime Day 2024.
New items that joined the top 10 keywords for the Home and Kitchen category for 2024 were rice cookers, coffee table and espresso machine. Stanley Black & Decker Inc (NYSE:SWK) sells its rice cooker on Amazon, while Nestle SA – ADR (OTC:NSRGY)-owned Nespresso offers espresso machines.
What Else: Amazon’s next major sales event will be Prime Big Deal Days on Oct. 8 and 9 to kick off the holiday shopping season.
Analysts are expecting growth for online retailers this holiday season as budget-conscious consumers look for a combination of value and convenience.
AMZN Price Action: According to Benzinga Pro, Amazon.com shares are down 1.46% at $188.38 at the time of publication Friday.
Needham analyst Laura Martin reiterated a Buy rating for Walt Disney Co (NYSE:DIS) with a $110 price target.
The re-rating is based on:
• Direct to Consumer (DTC) breakeven in fiscal 2024 with “double-digit” margins at maturity.
• 5.5 million to 6 million new subscribers from Charter Communications, Inc (NASDAQ:CHTR) starting in the second half of fiscal 2024.
• Disney’s $1.5 billion investment in Epic Games (to build Disney video games).
• 70% of $60 billion Parks CapX will be “incremental capacity” leading to a revenue boost.
• $8 billion of fiscal 2024 free cash flow, exclusive Taylor Swift concert rights for Disney+.
• A 50% higher dividend (to $0.90 per year) for a 1% yield.
• More than $3 billion of share repurchases in 2024.
Longer-term, Martin noted Disney’s asset mix of both digital and physical assets (i.e., an Omniverse) maximizes its economic value capture, that Disney benefits from generative AI and the company will be a takeover target by the Big Tech companies backed by its streaming moat and high-quality content libraries with hit film and TV franchises.
Martin lowered her fourth-quarter operating income and EPS estimates. Disney’s new fourth-quarter estimates are revenue of $22.2 billion, operating income of $3.6 billion, and adjusted EPS of $1.07.
Martin maintained her Entertainment revenue estimate of $10.6 billion. She cut her estimate for Linear Networks by 10% to $2.4 billion, reflecting continued linear subscriber declines in the quarter and the Disney carriage dispute with DirecTV exactly offset by higher box office revs for “Deadpool & Wolverine” in the Content Sales segment. Martin estimates the operating income for this division to be $665 million.
Martin maintained her estimates for Sports revenues at $3.8 billion but raised her estimated operating income by 11% to $922 million, reflecting momentum and cadence in this division, evidenced in the third quarter. Martin maintained her revenue estimate for Experiences of $8.2 billion but cut her estimate for operating income by 13% to $1.7 billion to reflect the guidance of losses in the “mid-single digits.”
DIS Price Actions: Disney stock is up 1.32% at $95.16 at publication Thursday.
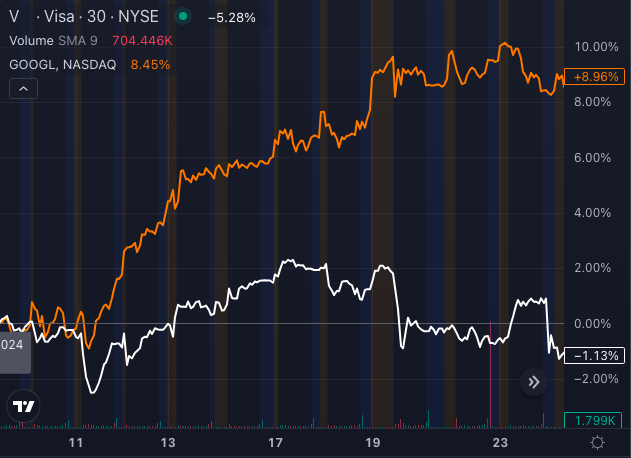
Visa Inc (NYSE:V) shares fell nearly 5% on Tuesday and continued trading lower on Wednesday following reports that the Department of Justice is suing the payment giant for allegedly monopolizing the country’s debit card market.
The lawsuit accuses Visa of engaging in anti-competitive practices, casting fresh scrutiny on the company’s dominance.
This news comes on the heels of Alphabet Inc‘s (NASDAQ:GOOGL) (NASDAQ:GOOG) antitrust battle earlier this month, which caused a temporary dip in the tech giant’s stock before it rebounded by about 10%.
Some investors may wonder if Visa’s stock could follow a similar trajectory.
Visa has long been in the regulatory crosshairs, facing accusations that it uses volume-based discounts to discourage merchants from shifting debit transactions to rival networks.
Brokerage TD Cowen noted that the Justice Department must prove that Visa’s discounts act as barriers to entry, preventing competitors from driving down prices.
While analysts agree this lawsuit poses immediate downside risks, they caution that antitrust cases are notoriously slow-moving.
KBW estimates that Visa’s U.S. debit business accounts for around 10% of its total revenues, and while the lawsuit may drag on, its long-term financial impact may be limited.
Is Visa Stock Offering A Buying Opportunity?
Visa’s recent stock action has caught traders’ attention.
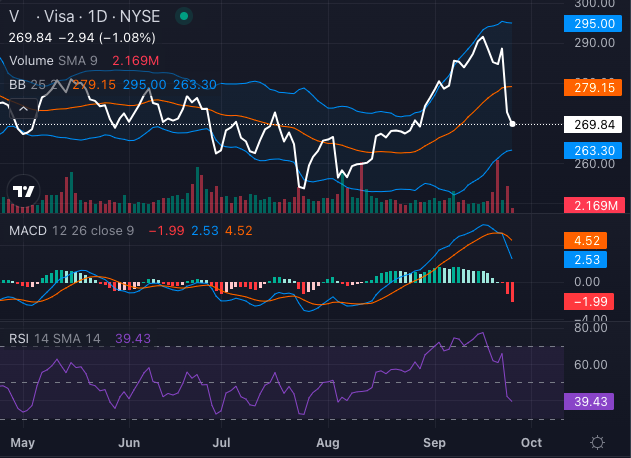
Visa stock is trading below all its moving averages, signaling a bearish trend.
The eight-day and 20-day simple moving averages of $283.96 and $281.81, respectively, indicate a short-term bearish signal, with Visa’s current price at $269.78. Moreover, the stock sits just below its 50-day and 200-day averages, reinforcing the bearish momentum.
However, any correction in the stock from this level could set the course again for a long-term bullish streak.
The Moving Average Convergence Divergence (MACD) is showing a bullish 2.53, while the declining Relative Strength Index (RSI) of 39.43 suggests Visa stock could soon be oversold.
As investors weigh the impact of the DOJ lawsuit, Visa’s stock may present a near-term buying opportunity, much like Alphabet’s rebound earlier this month.
In today’s rapidly changing and fiercely competitive business landscape, it is vital for investors and industry enthusiasts to carefully evaluate companies. In this article, we will perform a comprehensive industry comparison, evaluating Apple (NASDAQ:AAPL) against its key competitors in the Technology Hardware, Storage & Peripherals industry. By analyzing important financial metrics, market position, and growth prospects, we aim to provide valuable insights for investors and shed light on company’s performance within the industry.
Apple Background
Apple is among the largest companies in the world, with a broad portfolio of hardware and software products targeted at consumers and businesses. Apple’s iPhone makes up a majority of the firm sales, and Apple’s other products like Mac, iPad, and Watch are designed around the iPhone as the focal point of an expansive software ecosystem. Apple has progressively worked to add new applications, like streaming video, subscription bundles, and augmented reality. The firm designs its own software and semiconductors while working with subcontractors like Foxconn and TSMC to build its products and chips. Slightly less than half of Apple’s sales come directly through its flagship stores, with a majority of sales coming indirectly through partnerships and distribution.
Through a meticulous analysis of Apple, we can observe the following trends:
At 34.47, the stock’s Price to Earnings ratio significantly exceeds the industry average by 1.17x, suggesting a premium valuation relative to industry peers.
It could be trading at a premium in relation to its book value, as indicated by its Price to Book ratio of 51.62 which exceeds the industry average by 7.65x.
With a relatively high Price to Sales ratio of 9.11, which is 4.12x the industry average, the stock might be considered overvalued based on sales performance.
The Return on Equity (ROE) of 30.44% is 23.21% above the industry average, highlighting efficient use of equity to generate profits.
The Earnings Before Interest, Taxes, Depreciation, and Amortization (EBITDA) of $28.2 Billion is 94.0x above the industry average, highlighting stronger profitability and robust cash flow generation.
With higher gross profit of $39.68 Billion, which indicates 57.51x above the industry average, the company demonstrates stronger profitability and higher earnings from its core operations.
The company’s revenue growth of 4.87% is significantly lower compared to the industry average of 199.28%. This indicates a potential fall in the company’s sales performance.
Debt To Equity Ratio
The debt-to-equity (D/E) ratio measures the financial leverage of a company by evaluating its debt relative to its equity.
Considering the debt-to-equity ratio in industry comparisons allows for a concise evaluation of a company’s financial health and risk profile, aiding in informed decision-making.
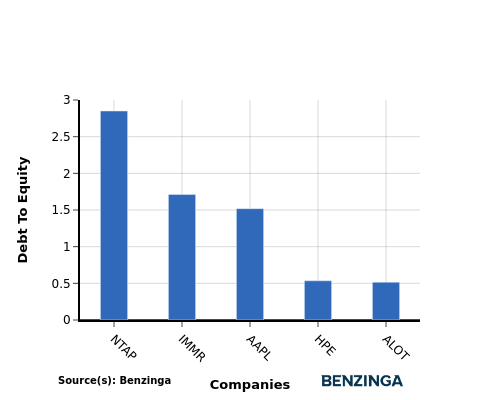
When assessing Apple against its top 4 peers using the Debt-to-Equity ratio, the following comparisons can be made:
When compared to its top 4 peers, Apple has a moderate debt-to-equity ratio of 1.52.
This implies that the company maintains a balanced financial structure with a reasonable level of debt and an appropriate reliance on equity financing.
Key Takeaways
For Apple, the PE, PB, and PS ratios are all high compared to its peers in the Technology Hardware, Storage & Peripherals industry, indicating that the stock may be overvalued based on these metrics. On the other hand, Apple’s high ROE, EBITDA, gross profit, and low revenue growth suggest that the company is efficiently utilizing its resources and generating strong profits, despite slower revenue growth compared to industry peers.
This article was generated by Benzinga’s automated content engine and reviewed by an editor.
Automotive parts retailer AutoZone Inc (NYSE:AZO) looks to keep its streak of earnings beats alive when the company reports fourth-quarter financial results before the market opens Tuesday, Sept. 24.
Earnings Estimates: Analysts expect AutoZone will report fourth-quarter earnings per share of $53.53, up from $46.46 in last year’s fourth quarter, according to data from Benzinga Pro.
The company has beaten earnings estimates from analysts in 19 straight quarters according to Benzinga Pro data.
Analysts expect the company to report fourth-quarter revenue of $6.22 billion, up from $5.69 billion in last year’s fourth quarter.
The company has beaten revenue estimates from analysts in eight of the past 10 quarters, but missed estimates in two of the last three quarters.
What Analysts Are Saying: Fourth-quarter sales are likely to be in-line with analyst estimates for AutoZone, Truist analyst Scot Ciccarelli said in a recent investor note.
The analyst said concerns over currency exchange rates could limit the international comparable sales. The auto parts sector also remains “challenging,” Ciccarelli added.
“Our data suggests that the beginning and end of the quarter were a bit softer, with relative strength in late June and July, but a reasonably steady cadence throughout,” Ciccarelli said.
Ciccarelli also expects gross margins to improve 60 basis points year-over-year in the fourth quarter thanks to holding retail prices steady and being able to lower procurement costs.
“We remain aggressive buyers of AZO, think fundamentals are poised to reaccelerate and believe they will continue to take share over time in a highly favorable vertical.
Here are other recent analyst ratings on AutoZone and their price targets:
Evercore ISI: Maintained Outperform rating, lowered price target from $3,900 to $3,350
Wedbush: Reiterated Outperform rating with $3,200 price target
Key Items to Watch: Data from Placer.ai showed AutoZone had visits increase 4.4% year-over-year during the second quarter of the calendar year. Visits were up 7.3%, 2.7% and 5.5% year-over-year for June, July and August, respectively.
The report said auto parts retailers such as AutoZone are “sustaining their pandemic-era success and benefitting from the increase in older cars on the road.”
For AutoZone, the trend of repairing vehicles versus replacing them with new ones could continue to benefit the company, according to the report.
The company placed partial blame on the timing of tax refunds and the weather in the third quarter. While tax refunds won’t be an item to watch in the fourth-quarter results, the weather could be.
“As we begin our all-important summer selling season, we are very excited about the initiatives we have in place to enhance our inventory availability, continue to accelerate our domestic commercial business and provide great customer service,” CEO Phil Daniele said in the third-quarter results.
AZO Price Action: AutoZone stock closed Monday up 0.93%% to $3,048.82 on Monday versus a 52-week trading range of $2,375.35 to $3,256.37.
The U.S. Commerce Department proposed Monday an outright block on the import and sale of Chinese-made vehicles that contain key communications and automated driving systems due to national security concerns.
This sweeping proposal, reported by Reuters, would have the effect of shutting out nearly all Chinese cars from the U.S. market, intensifying the ongoing economic standoff between the two global superpowers.
The proposed regulation would not only target vehicles but also encompass the software and hardware integral to modern connected cars.
This means that any vehicle equipped with systems that facilitate internet connectivity or data sharing — which are now ubiquitous in newer models — could be banned if these technologies are sourced from China or any other nation deemed a foreign adversary, including Russia.
Heightened Security Concerns
The Biden administration has expressed growing concerns over the potential for data collected by Chinese automakers and tech companies to be used for espionage or to undermine U.S. infrastructure.
With many modern cars linked to the internet, allowing them to communicate with external systems for navigation, safety features, and data storage, officials worry that Chinese companies could exploit these connections to gather sensitive information or even manipulate vehicle operations remotely.
For instance, an extreme scenario, as warned by government officials, could see adversaries remotely controlling vehicles or causing accidents at scale.
Impact On The Auto Industry, Stock Reactions
This new ban, if enacted, could be a game changer for the automotive industry. Chinese automakers such as BYD, Nio and Xpeng, which have been eyeing the U.S. market, would face significant roadblocks.
Even American and other international automakers that source components from Chinese suppliers could be impacted, especially when it comes to hardware and software development.
The Alliance for Automotive Innovation – a trade group representing major automakers including General Motors Co. (NYSE:GM), Toyota Motor Co. (NYSE:TM), Volkswagen AG (OTCPK: VWAGY), and Hyundai Motor Co., Ltd (OTCPK: HYMTF) – has expressed caution about the proposed bans, according to Reuters.
Automakers noted that connected vehicle components are sourced globally, including from China, and that reconfiguring supply chains to avoid Chinese software and hardware could prove challenging.
While the group has not yet provided a detailed breakdown of how extensively Chinese-made parts are used in U.S. vehicles, it’s clear the proposed bans would require significant adjustments for automakers operating in the U.S. market.
Shares of General Motors fell over 3% during Monday premarket trading, while Ford Motor Co. (NYSE:F) rose 1.3%.
Shares of major Chinese automakers had mixed reactions. NIO Inc. (NYSE:NIO) fell over 2%, while XPeng Inc. (NYSE:XPEV) dropped 0.8%. In contrast, Li Auto Inc. (NASDAQ:LI) managed to rise by 1%, bucking the downward trend.
Broadening Trade War
This move is part of a broader campaign by the U.S. government to curb China’s influence in the American economy. Just last week, the Biden administration imposed hefty tariffs on Chinese imports, including a 100% duty on electric vehicles and key minerals used in EV batteries.
These combined measures could reshape the competitive landscape in the U.S. auto market, particularly in the growing electric vehicle sector.
In addition, the proposal could hamper Chinese companies’ ability to test self-driving or autonomous cars on U.S. soil, limiting their participation in an industry expected to revolutionize transportation over the coming decades.
Timeline For Ban
The proposed rules would phase in over the next several years. Software restrictions would apply to vehicles from the 2027 model year onward, while hardware bans would take effect for 2030 models, starting as early as January 2029, Reuters said.
This phased approach is designed to allow automakers time to adapt their supply chains and eliminate Chinese components from their vehicles. Given the global nature of the automotive supply chain, transitioning away from Chinese-made components could be a costly and complex process.
Hosted by Aaron Bry and Dennis Dick, the discussion highlighted how the massive expiration of key options contracts can drive unusual market activity and set the stage for turbulence ahead.
Triple witching, which occurs quarterly on the third Friday of March, June, September, and December, is when stock index futures, stock index options, and individual stock options expire simultaneously.
This event often creates market turbulence, as traders scramble to close, roll over, or offset expiring contracts.
Over $5 trillion in notional options, including $605 billion in single-stock options, are expected to expire during Friday’s session.
Historically, triple witching has led to increased volatility and unusual price movements. The S&P 500, tracked by the SPDRS&P 500 ETF Trust (NYSE:SPY), closed in the red on the last three triple witching days:
June 21, 2024: S&P 500 fell by 0.5%.
March 15, 2024: S&P 500 dropped by 1%.
Dec. 15, 2023: S&P 500 declined by 0.6%.
Historical Weakness Post-Witching Week
During his appearance on Benzinga PreMarket Prep, CC Lagator explained how the convergence of expiring options impacts the market.
“You might see some imbalances that you wouldn’t have seen on a normal day at the open,” CC Lagator said, highlighting how trading activity starts to unwind a couple of days before but accelerates toward the close of the session.
This often stems from big hedge funds and mutual funds rolling options positions into the next month, which can lead to increased volatility. He further noted that the market environment shifts drastically after triple witching, with traders facing a completely new landscape in the following week.
“Next week historically is a terrible week going back decades,” Lagator said, noting that the week after triple witching in September has rarely shown positive returns over the last 30 years.
With volatility expected to pick up, he cautioned that traders should brace for a challenging week due to the impact of unwinding positions on the broader market.
The conversation also turned to the Volatility Index (VIX), often referred to as the “fear gauge,” which CC Lagator described as being relatively low and attractive for call option buyers at these levels.
“The VIX is at 16 right now, it’s not high,” CC Lagator stated, adding that it trades below its long-term average of 19.
“If this was July and we were at all-time highs, the VIX would probably be 13,” he noted, attributing the slight uptick to recent market events and the seasonal volatility that accompanies the fall months.
“For traders looking at the next month and a half, there’s not much worry about volatility dropping much lower than where it is now,” Lagator predicted, adding that “we’re probably not seeing it hit 12 until Christmas.”
Lagator advised that traders could use this period of low volatility to their advantage when considering options positions.
“If you were buying at-the-money options right now, you probably don’t have much to worry about in terms of volatility going much lower,” he said, emphasizing the stability of current volatility levels as a potential buying opportunity for those seeking to hedge or position themselves for a breakout.
A similar view has also been shared by Goldman Sachs, which estimates that, given macroeconomic conditions, the VIX should be at 24.5 points.
The investment bank issued a recommendation for investors to hedge their portfolios using VIX calls. Specifically, Goldman Sachs analysts advise buying CBOE Volatility Index (VIX) November calls at a strike price of 18.
S&P 500’s 5 Top Gainers, 5 Worst Laggards After Friday’s Market Open