Soaring memory costs will push the company’s gross margins from 75% in the second quarter to 71%–72% in the fourth quarter. Nvidia expects margins to recover only after higher prices take effect in fiscal 2028.
But what caused the decline? An AI buildout so expensive that it inflates the cost of the components Nvidia needs to build its own systems.
That creates a new problem for the Santa Clara, California-based company: Demand is still overwhelming supply, but some of that scarcity is now working against it.
Memory Prices are Becoming Nvidia’s Problem
Nvidia delivered $96 billion of revenue in the second quarter, more than double the year-earlier figure. It also expects fiscal 2028 revenue to grow approximately 70%.
Yet investors are being asked to accept lower profitability while that growth accelerates.
Colette Kress, Nvidia’s chief financial officer, said the company is facing “extreme pricing conditions in memory.”
“The magnitude of the price increase has exceeded our prior expectations and are headed even higher into next year,” she added.
That is the clearest signal yet that memory has become a meaningful constraint inside the AI infrastructure boom.
Every accelerator Nvidia ships carries high-bandwidth memory it buys from someone else, mainly Micron Technology Inc.(NASDAQ:MU), SK Hynix Inc. (NASDAQ:SKHY) and Samsung Electronics, and that memory has become the fastest-inflating line in the bill of materials for an AI server.
Nvidia said memory scarcity is “being driven in large part by the AI build-out itself.” In other words, the same demand surge creating Nvidia’s revenue growth is also making some of its inputs more expensive.
That makes memory inflation different from an ordinary cost shock.
The pressure is visible in Nvidia’s guidance. Gross margins are expected to be 74% in the third quarter, then fall to 71%–72% in the fourth quarter.
That would mark the first major sequential deterioration in margin of the current AI cycle.
Nvidia Can Raise Prices. But Timing Matters
Nvidia can raise prices to offset higher memory costs, but there is a delay. Memory prices are still rising now. Nvidia’s price increases will start showing up in fiscal 2028.
That means margins will take a hit first. They should recover later as higher prices are passed on to customers.
The key question for investors is how long that gap lasts.
Nvidia still has plenty of demand. The company says demand is growing about 100% next year, but supply limits revenue growth to roughly 70%.
As CEO Jensen Huang said, “The unconstrained would be a lot higher.”
The AI Supply Chain Is Changing
Nvidia is still growing at an extraordinary pace. But rising memory costs mean the company may not keep all the benefits of that growth.
Some of the money is flowing to the companies supplying the components Nvidia needs.
Memory is the clearest example.
Nvidia expects revenue to grow about 70% in fiscal 2028. But if memory prices remain high, Nvidia could earn slightly less profit per dollar of sales.
That makes gross margins almost as important as revenue growth in the next phase of the AI boom.
Three gold miners, two asset-management giants and a high-flying semiconductor were among the large-cap movers on the pre-market board following a cooler-than-expected producer inflation report on Wednesday.
Producer prices fell 0.3% in June, the softest monthly print since April 2025, a day after consumer inflation posted its steepest monthly decline since April 2020.
According to Benzinga Pro data, here are the best-performing stocks with a market cap above $50 billion in the 30 minutes of pre-market trading following the release, from 8:30 a.m. to 9:00 a.m. ET.
10. Robinhood Markets Inc.
Robinhood Markets Inc. (NASDAQ:HOOD) rose 1.04%. As stock futures rose, retail brokerages carry a direct link to risk appetite, and a market pricing a less aggressive rate path is a market that trades more.
9. Barrick Mining Corp.
Barrick Mining Corp. (NYSE:B) added 1.04%, as gold advanced 0.46% to $4,058.78 an ounce.
Agnico Eagle Mines Ltd. (NYSE:AEM) rose 1.16%, reflecting gold’s rebound.
4. BlackRock Inc.
BlackRock Inc. (NYSE:BLK) gained 1.20%, fueled by strong-than-expected second quarter earnings.
3. Bloom Energy Corp.
Bloom Energy Corp. (NYSE:BE) advanced 1.23%, as lower Treasury yields helped stocks with high multiples.
2. Newmont Corp.
Newmont Corp.(NYSE:NEM) rose 1.29%, the largest gold producer on the list and the second-best performer on the board.
1. Bank of Nova Scotia
Bank of Nova Scotia(NYSE:BNS) led the entire board at 1.99%. A softer dollar and a lower North American front end both cut in the bank’s favor, and it is the only commercial lender on the board.
Top Large-Cap Gainers After June PPI
Rank
Ticker
Company
Price
Change
1
BNS
Bank of Nova Scotia
$90.52
+1.99%
2
NEM
Newmont Corp.
$95.22
+1.29%
3
BE
Bloom Energy Corp.
$247.72
+1.23%
4
BLK
BlackRock Inc.
$1,080.00
+1.20%
5
AEM
Agnico Eagle Mines Ltd.
$145.00
+1.16%
6
MRVL
Marvell Technology Inc.
$224.95
+1.10%
7
SHOP
Shopify Inc.
$126.00
+1.08%
8
BX
Blackstone Inc.
$126.88
+1.05%
9
B
Barrick Mining Corp.
$36.60
+1.04%
10
HOOD
Robinhood Markets Inc.
$114.58
+1.04%
Source: Benzinga Pro – 8:30 a.m. – 9:00 a.m. ET pre-market | Market cap > $50B | July 15, 2026
Why The Gold Complex Did The Heavy Lifting
Newmont, Agnico Eagle and Barrick occupied three of the 10 slots. Miners are a levered claim on the metal, and the metal is a claim on real rates.
As traders trim the odds of further Fed hikes, gold — among the most heavily penalized assets of recent months — catches a bid.
For most of 2026, gold, silver and Bitcoin have been a painful place to put money.
The reason is not hard to find: a fast-shifting outlook for Federal Reserve policy.
The year opened with hopes for rate cuts. Then the war in Iran sent energy prices surging, revived inflation, and flipped the market’s bet from lower rates to higher ones.
For gold, silver and Bitcoin, assets that pay no yield and rise or fall on the path of interest rates, that shift was brutal.
From their January peaks, the SPDR Gold Shares (NYSE:GLD) has fallen about 26%, the iShares Bitcoin Trust(NASDAQ:IBIT) roughly 37%, and the iShares Silver Trust(NYSE:SLV) close to 50%.
Now, almost in unison, all three are rebounding again, for the very same reason they lost it, only in reverse.
An Oil-Driven Disinflation
The Cleveland Fed’s inflation nowcast now shows negative month-over-month readings for both June and July, with headline consumer prices running at minus 0.06% and minus 0.22%, respectively.
WTI crude has slumped to around $68 a barrel, back to where it traded at the end of February before the war began.
That collapse has a clear source.
Since the United States and Iran agreed in mid-June to halt fighting and reopen the Strait of Hormuz, the chokepoint that had been largely closed since February, Gulf supply has flooded back.
Saudi Aramco just cut the official price of its flagship Arab Light grade to Asia for August by $11 a barrel, swinging it from a $9.50 premium to a $1.50 discount over the regional benchmark, as reported by Bloomberg on Monday.
It was the biggest reduction in at least 26 years and far deeper than the $8 cut analysts had expected.
The Hike Narrative May Lose Its Fuel
On the surface, the hawkish case is still standing.
The U.S. economy is expanding at around 2%, with recent core inflation prints in the 3%-4% annualized range, which, on its own, argues for tighter policy.
“The question for hikes seems to be one of when, not if,” said Enrique Díaz-Alvarez, chief economist at Ebury.
Underneath, the data has moved the other way.
The U.S. economy added just 57,000 nonfarm payrolls in June, well short of the roughly 110,000 economists expected, with prior months revised lower.
Traders moved quickly. Odds of a September rate hike, tracked via CME FedWatch, slid from around 66% to near 53%, and the policy-sensitive 2-year Treasury yield eased toward 4.13%.
At the European Central Bank’s Sintra forum, Fed Chair Kevin Warsh said inflation expectations “have come down in recent weeks,” reinforcing the softer tone.
The New York Fed’s May survey put one-year inflation expectations at 3.5%, versus 3.1% three years out, a gap that Ed Yardeni reads as a sign that households see today’s price pressure as temporary rather than structural.
Futures markets had been pricing a rising chance of hikes into year-end, with a nearly one-in-five probability of a target range as high as 4.00% to 4.25% by December.
That pricing is now eroding.
Why Gold, Silver And Bitcoin Are The Unwind Trade
22V Research’s strategist Jordi Visser laid out the mechanics.
“If the Fed-hike positioning unwinds, it’s good for gold, silver, and Bitcoin,” Visser said.
The logic runs through positioning. When the market prices in high rates, the opportunity cost of holding a non-yielding asset rises, and Treasurys look more appealing.
When those rate-hike odds unwind, the calculation reverses just as fast. A dovish repricing hands back exactly what a hawkish one took away.
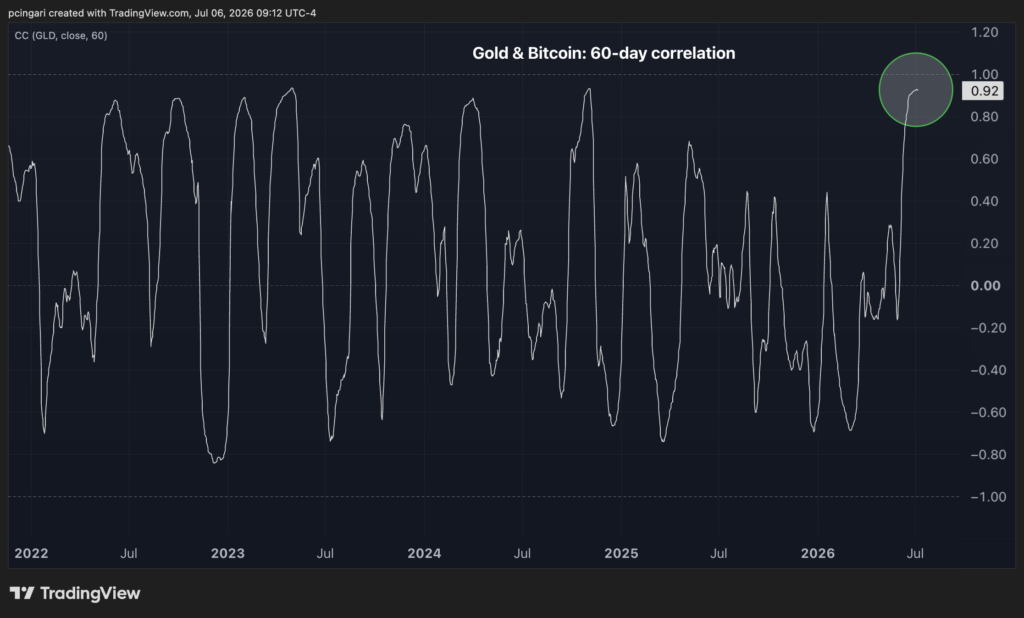
Gold and Bitcoin are now moving almost in lockstep, their 60-day correlation at 0.92, a sign the two are trading as a single macro expression of the same rate view.
What’s Next?
The relief rally in Bitcoin, gold and silver rests on one assumption: that the disinflation is real and durable. It may not be.
The drop is almost entirely energy. Core inflation, which strips out food and fuel, remains firm, with the Fed’s preferred core PCE gauge last at 3.4%, and average hourly earnings still running around 3.5% year-over-year.
That keeps Warsh’s inflation-first Fed in a policy box. The decisive data point is the June CPI report due July 14.
For now, the takeaway is simple: the trade that punished gold, silver and Bitcoin all year has begun to reverse, and its staying power hinges on upcoming data.
Gold prices are testing one of the most closely watched levels in technical analysis: the 200-day moving average.
After a blistering rally that carried bullion to record highs at $5,600 earlier this year, the metal has spent recent weeks consolidating and is now hovering directly above its long-term trend line.
For many traders, a break below the 200-day moving average is viewed as a bearish signal. Recent history suggests the opposite may be true for gold.
Gold’s Previous 200-Day Average Breakdowns Became Buying Opportunities
Spot gold – tracked by SPDR Gold Shares(NYSE:GLD) – changed hands near $4,500 per ounce on Wednesday, up roughly 1.5% on the day, after a multi-week pullback dragged it back down toward its rising 200-day average near $4,397.
The metal sits about 20% off the early-February peak above $5,600.
Data compiled from the last 10 occasions when gold fell below its 200-day moving average show that weakness has historically been followed by strong longer-term gains.
Across the full set of the last 10 episodes, forward returns strengthened the longer investors held: the average one-month change was essentially flat (−0.15%), but six months out, the average gain was 3.5% (70% positive), and one year out, the average was 8.4% with a 60% win rate and a return-to-volatility ratio of 0.57.
Table: Gold’s last 10 breakdown events of 200-day moving average
The signal sharpens after the 2021 chop. Filtering to the six most recent tests — from January 2022 through September 2023 — every single one was higher one year later.
Gold’s last six breaks below its 200-day moving average all produced positive returns one year later, generating an average gain of 17.3% and a median gain of 11.5%.
The takeaway: the 200-day line has repeatedly marked an opportunity rather than a top, even when the next few weeks stayed choppy.
Forward Return (Last 6 episodes)
Average
Median
Win Rate
1 Month
0.59%
1.65%
66.7%
3 Months
1.79%
2.34%
66.7%
6 Months
3.15%
1.89%
50%
1 Year
17.27%
11.49%
100%
The Sentiment Shift
“Gold is sitting right at its 200-day moving average,” Tavi Costa, founder of Azuria Capital, wrote in his latest note on Substack.
“The last time we were here turned out to be a great buying opportunity.”
Yet, the technical setup is only half the story.
A few months ago gold was one of the market’s most crowded longs; today, Costa says, it feels almost forgotten.
“I’m starting to get greedy while others are becoming fearful,” Costa said, riffing on Warren Buffett.
In a recent Kitco News interview, Costa framed the simultaneous selloff in gold and silver as a normal digestion of an outsized rally, not a broken thesis.
“The debasement of currencies and the hard-assets thesis remains as strong as it could be,” he said.
His core view — that fiscal deficits, compounding debt and currency debasement keep the structural bid under hard assets intact — has not changed, even as he flags rising populism and government equity stakes as fresh macro risks.
Wall Street responded with something it has done only seven times in the company’s more than half-century history.
IBM shares closed Thursday at $252.97, marking a one-day jump of roughly 12%. Week-to-date through Friday, IBM is posting its best-performing week since October 2002.
The catalyst was a federal letter of intent under the Biden-era CHIPS and Science Act to seed IBM’s Anderon, a quantum chip wafer foundry, which will fabricate 300-millimeter quantum wafers in Albany, New York.
A Weekly Rally This Rare Happened Just Seven Times In IBM’s History
A weekly advance of 15% or more in IBM has appeared just seven times since the company went public in 1967.
The most recent comparable episode before this week landed in October 2002, near the bottom of the dot-com collapse, when the stock rose 16% in a week.
On average, IBM was higher one month later in five of six cases and higher a year later in four of six. But the six-month window is the soft spot. The stock won only a third of the time over that horizon, and the average return there is slightly negative.
The CHIPS and Science Act is the 2022 law that uses federal money to bring advanced chip manufacturing back onto American soil.
This week, the Department of Commerce committed $2 billion of it to nine quantum companies. IBM was the largest single recipient with $1 billion. It shares funds with Anderon, which IBM describes as the country’s first pure-play quantum foundry.
A foundry is a contract factory. It does not design the product. It manufactures it for whoever places the order.
The closest analogy is the relationship that already exists in conventional chips, where one specialist factory builds processors for dozens of rival design houses.
Anderon would do the same for quantum hardware, supplying wafers to IBM and to its competitors alike.
Other smaller beneficiaries included GlobalFoundries, Atom Computing, Diraq, D-Wave, Infleqtion, PsiQuantum, Quantinuum and Rigetti Computing Inc.(NASDAQ:RGTI)
IBM is matching the federal $1 billion with $1 billion of its own cash, plus intellectual property and staff. In return, the Donald Trump administration takes a minority, non-controlling equity stake.
The structure mirrors recent federal deals in semiconductors and rare earths.
Cruise stocks were supposed to be the cleanest ceasefire trade on the board. Brent off the highs, Strait of Hormuz rumors of reopening, a consumer that everyone said was still spending.
Carnival Corp. (NYSE:CCL) rallied 16% from its March 30 low. Norwegian Cruise Line Holdings Ltd.(NYSE:NCLH) bounced 11%. Royal Caribbean Group(NYSE:RCL) followed.
Then, Wall Street analysts started running the numbers against $90 crude.
And the numbers did not cooperate.
Bank of America analyst Andrew G. Didora became the latest to cut on Wednesday morning, trimming Royal Caribbean’s price target from $330 to $310 and Norwegian Cruise’s from $27 to $25.
The Cruise Ceasefire Rally Meets Reality: BofA Is The Latest To Cut
“1Q26 earnings season should focus on the demand impact of the Iran conflict and the flow through of higher commodity prices,” Didora said in a note.
BofA did not move alone. Morgan Stanley cut Norwegian Cruise’s price target from $24 to $23. UBS took it from $27 to $22. Wells Fargo & Co. cut from $32 to $26. Tigress Financial went from $38 to $32. Barclays trimmed from $22 to $21 .
Every major bank covering the industry has reported lower numbers over the last three weeks.
The pattern is a coordinated rewrite of the same two assumptions: fuel costs are running hotter than models priced, and European bookings are softer than management expected.
Both variables point in the same direction — 2026 yields and earnings per share were too high. Net yield is the cruise industry’s pricing thermometer. It measures net revenue — ticket sales plus onboard spending on drinks, casino, excursions – divided by the berth-days a ship has available to sell.
Think of it as dollars earned per cabin per night, stripped of commissions and pass-through costs.
“As the conflict has continued, we think net yields in 2Q-4Q26 could be softer than initially expected,” Didora said.
“NCLH noted in early March that 2026 bookings were slightly below its optimal booking range and we think any slowdown in the consumer’s booking appetite will only hurt pricing. As such, we expect pricing to remain under pressure,” he added.
What $90 Crude Does To A Cruise Ship’s Income Statement
Cruise lines burn marine bunker fuel, and bunker prices track crude with a one-to-two-week lag.
Brent at $98 per barrel and West Texas Intermediate near $89 – both up roughly 47% year-over-year – translate directly into higher 2026 fuel bills.
BofA just raised its 2026 fuel cost estimates by $174 million for Royal Caribbean and $81 million for Norwegian Cruise.
The fuel price per metric ton assumed for the second quarter jumped 24% for Royal Caribbean and 19% for Norwegian versus prior estimates.
Hedging cushions the blow – Royal Caribbean is 60% hedged for 2026, Norwegian is 51% hedged – but hedging only delays the pain, it does not eliminate it.
Market Reactions And What To Look Next
Shares of Royal Caribbean fell 1% during Wednesday’s morning trading. Norwegian Cruise slipped 0.5%, while Carnival added 0.4%.
Royal Caribbean reports first-quarter earnings on April 30, before the open. Norwegian follows a week later.
What investors will be listening for is not the first quarter print – those numbers are already tracking close to guidance – but the forward commentary.
The ceasefire rally was a reflex. The revision wave is the slow burn.
Cruise stocks have spent three weeks pricing in peace. The question the earnings season will answer is whether they also priced in $90 crude.
The IEA’s director general Fatih Birol has described the current situation at the Strait of Hormuz as the worst energy crisis in history. Oil – which is trading above $90 a barrel – is still 38% above where it traded the day before the conflict began.
At $4.09 per gallon nationally, and $5.86 in California, the pump is not signaling resolution.
Yet seven major energy producers and refiners — the companies that drill the oil, refine the gasoline, and collect the margin — are trading as if Hormuz is already open, the crisis is resolved, and crude is heading back to $65.
Their forward price-to-earnings multiples sit between 7x and 11x, roughly half the S&P 500’s consensus forward P/E of around 22x.
The disconnect is not subtle. It is structural.
The Energy Stocks That Didn’t Get The Memo
The State Street Energy Select Sector SPDR ETF(NYSE:XLE) is up 27% year-to-date, which sounds impressive until you consider that crude oil is up 38% from pre-war levels.
The sector has underperformed its own commodity — and pulled back 10% from its March peak — even as the underlying supply disruption has not materially improved.
That compression is where the opportunity, and the risk, lives.
The April drawdown is the mechanism that created this entry point.
Every name in the table has sold off between 5% and 14% month-to-date, even as WTI has held around $90 and Brent has pushed toward $95.
APA Corporation(NASDAQ:APA), the cheapest name at 7.2x forward P/E, has shed nearly 14% in April alone. Devon Energy Corporation(NYSE:DVN) trades at 8.6x forward earnings against a median analyst target implying 31.6% upside. Expand Energy Corporation(NASDAQ:EXE) — the lone name still negative on the year — carries the widest analyst upside in the group at 38.5%.
Forward price-to-earnings — next-twelve-months P/E — divides the stock price by the earnings analysts expect the company to produce over the coming year. A lower number means investors are paying less for each dollar of expected profit. At 7x to 11x, these names are priced as though the energy cycle ends soon.
Refiners Marathon Petroleum Corporation(NYSE:MPC) and Valero Energy Corporation(NYSE:VLO) present their own logic: crack spreads — the margin between crude input cost and refined product price — typically widen when crude stays elevated and demand holds.
Both names trade below 11x forward earnings despite a supply environment that should structurally support refining margins through the summer driving season.
Company
P/E (Next Twelve Months)
Analyst Target Upside (Med.)
MTD
YTD
APA Corporation
7.2x
+9.3%
−13.8%
+49.6%
Devon Energy Corporation
8.6x
+31.6%
−10.1%
+23.5%
EOG Resources, Inc.
9.5x
+12.2%
−8.4%
+26.1%
Expand Energy Corporation
10.7x
+38.5%
−12.5%
−13.0%
Marathon Petroleum Corporation
10.7x
+9.4%
−8.7%
+37.1%
Valero Energy Corporation
11.2x
+8.1%
−4.9%
+44.4%
Coterra Energy Inc.
11.3x
+13.9%
−10.1%
+20.1%
What’s The Market Actually Pricing In?
Energy stocks have always traded at a discount to the broader market, reflecting the cyclical nature of commodity earnings. But a 50%-plus discount in an environment where oil has been above $80 for more than six weeks — and where there is no immediate resolution to the Strait of Hormuz disruption — is unusual.
The explanation lies in what the market is implicitly pricing. Investors assigning a 7x or 8x multiple to an oil producer are assuming one of two things: either the oil price collapses back toward $60 on a ceasefire, or the earnings cycle peaks before they can compound.
Both are reasonable risks. Neither is certain.
The disconnect is sharpest at APA Corp., which trades at 7.2x forward earnings despite a 49.6% year-to-date return — still the lowest multiple among large-cap U.S. producers.
Devon Energy Corp. shows the most analyst conviction, with a median price target implying 31.6% upside from current levels despite an already strong run.
What This Means For Investors
The valuation gap is a two-sided trade. On one side, if the Hormuz disruption proves durable — no ceasefire, no rerouting solution that meaningfully restores flow — then $90 oil becomes the floor, not the ceiling, and 7x to 11x multiples look like a significant mispricing.
Every dollar of oil above $70 flows almost directly to free cash flow for low-breakeven producers like EOG Resources and Coterra Energy.
On the other side, a rapid ceasefire and Strait reopening could bring oil back toward $65 to $70 within weeks, compressing earnings and making current multiples look less attractive in hindsight.
The market is not wrong to embed that optionality — it is simply the question of which scenario deserves more weight.
Seven of the cheapest stocks in the S&P 500 right now happen to be in the sector with the most direct exposure to the defining macro story of 2026.
Whether that is an opportunity or a trap depends entirely on a waterway 7,000 miles from Wall Street.
The market’s AI trade just flipped from euphoria to fear, and four major industries are suddenly in the bargain bin.
In a note shared Thursday, veteran investor Ed Yardeni said investors have moved from “AI-phoria to AI-phobia,” hammering Software, Brokers, Insurers and Asset Managers in just weeks.
Instead of bidding up anything with an AI angle, markets are now punishing companies seen as vulnerable to it.
1. Software: Disruption Or Discount?
Software stocks have taken the hardest hit.
The iShares Tech-Expanded Software Sector ETF(NYSE:IGV) is down nearly 20% year-to-date, making it the worst-performing industry group.
The catalyst? Fears that AI-native tools — like Anthropic’s Claude — could disintermediate traditional enterprise software providers in areas like legal services, finance and sales.
Data providers were not spared.
Thomson Reuters Corp. (NASDAQ:TRI) shares have fallen 31.1% year to date and 57.6% from their high last summer. RELX plc(NYSE:RELX), the parent of LexisNexis, is down 30% this year and 47.4% from their May peak.
FactSet Research Systems Inc. (NYSE:FDX) has slid 30% year to date and 57.3% from its Dec. 2, 2024 high. S&P Global Inc. (NYSE:SPGI) is off 25% in 2026 and 30% from last August’s peak.
Investors quickly extrapolated: if generative AI can perform specialized workflows, do companies still need high-priced application software?
“For those who lived through the advent of the Internet, this feels like déjà vu all over again,” Yardeni said.
Forward price-to-earnings ratios have compressed sharply.
Application Software now trades at 23.7 times forward earnings, down from 35.3 at its recent high. Systems Software trades at 23.3, down from 35.5.
Cheap for a reason — or simply cheap?
2. Brokers: If AI Can Advise, What Happens To The Advisor?
Investment banks and brokerage firms also saw pressure after fintech firm Altruist rolled out AI tools capable of recommending personalized tax strategies.
The fear: if AI can optimize taxes today, could it handle broader financial advice tomorrow?
The S&P 500 Investment Banking & Brokerage index – as tracked by the iShares U.S. Brokers-Dealers & Securities Exchanges ETF(NYSE:IAI) – is only modestly positive year-to-date — but some individual names have fallen 7% to 10% from recent highs.
Shares of Raymond James Financial Inc.(NYSE:RJF) sunk by 9% on Tuesday – the company’s worst session since March 2020. Charles Schwab Corp.(NYSE:SCHW) also dropped 8% on the same day.
The industry’s forward P/E has dropped from 24.7x to 15.9x. Yet, this is less about current earnings and more about long-term margin pressure.
If AI reduces friction in financial advice, traditional advisory models could face structural competition.
3. Insurance Brokers: Automation Anxiety
Insurance brokers were also hit after reports that AI-driven tools are being integrated directly into conversational platforms to generate personalized insurance quotes.
“OpenAI approved an insurance application for ChatGPT developed by the Spanish digital insurer Tuio,” Yardeni highlighted as key news disrupting the sector.
If underwriting, comparison and quoting become seamless within AI interfaces, where does the broker fit?
The S&P Insurance Brokers industry index – as closely tracked by the State Street SPDR S&P Insurance ETF (NYSE:KIE) – has fallen 4% year-to-date. Shares of major players have dropped sharply from their peaks.
Yet insurance remains relationship-driven and compliance-heavy — areas where incumbents maintain advantages.
Again, the core issue is earnings durability. Will AI meaningfully erode commissions? Or will brokers incorporate AI into their own distribution channels?
4. Asset Managers: Collateral Damage
Alternative asset managers may be the most indirect casualties of the AI selloff, according to Yardeni.
Investors worry they have significant exposure to private software companies — both through equity stakes and private credit.
As public software valuations decline, exit opportunities shrink and concerns rise about marks on private portfolios.
Several large alternative managers are down double digits year-to-date — and significantly more from their late-2024 highs.
Shares of KKR Inc.(NYSE:KKR) and Apollo Global Management Inc.(NYSE:APO) have fallen by 16% and 11% year-to-date, respectively.
“Before worries about their exposure to software weighed on the stocks, they’d been facing investors’ fears that credit losses in a wide variety of industries lurk in their private loan portfolios,” Yardeni said.
Meanwhile, Blue Owl Capital Inc. (NYSE:OWL) has already fallen more than 50% from its record highs.
Are These Industries Cheap Enough Now?
“These industries’ forward P/Es have plummeted to ridiculously low levels relative to current earnings projections,” Yardeni said.
According to Wall Street consensus estimates for 2026, earnings growth projections remain intact:
Those multiples are dramatically lower than recent peaks. In several cases, they’ve fallen from the mid-30s to the low-20s — or from the mid-20s to the mid-teens.
On paper, that looks like a reset.
But the market isn’t debating valuation in isolation — it’s debating durability.
“Will AI competition trigger downward earnings revisions as contracts are renewed? That’s the risk,” Yardeni said.
Gold’s sharp pullback last week rattled markets and fueled speculation that the precious metal’s historic rally had finally run its course.
Yet, veteran economist Ed Yardeni says the selloff doesn’t change the bigger picture — and his $6,000 gold target by the end of 2026 remains intact.
In his latest morning briefing, Yardeni challenged the prevailing narrative that the selloff was sparked by President Donald Trump‘s nomination of Kevin Warsh as the next Federal Reserve chair. In his view, the timing simply doesn’t line up.
“I’m still sticking with my 6,000 by the end of the year,” Yardeni said.
“At the end of the decade… I think 10,000 is reasonable,” he added.
Gold Was Already Falling Before The Fed News
Yardeni highlighted that gold prices – as tracked by the SPDR Gold Shares(NYSE:GLD) – were already falling Thursday night — well before Warsh’s name was formally announced on Friday.
“I was watching it the night before,” Yardeni said, noting that gold had already declined by hundreds of dollars at one point.
That sequence, he argued, suggests markets were reacting to diminishing uncertainty rather than suddenly reassessing monetary policy.
Several geopolitical risks that had been supporting precious metals appeared to be moderating at the same time, including reports that Iran was open to negotiations and signs that the administration was attempting to cool other global flashpoints.
Margin Calls Were The Real Trigger
While headlines focused on Warsh’s perceived hawkishness, Yardeni indicated a far more tangible catalyst: leverage.
On Friday afternoon, CME Group raised margin requirements on gold, silver, and other metals futures due to extreme volatility. That move forced traders to either post additional capital or unwind positions.
According to Yardeni, the sharp acceleration lower came after a more mechanical trigger.
“That meant a lot of the leverage that we get in the precious metals futures markets had to consider whether it wanted to remain leveraged and make margin calls or cash in the chips,” Yardeni said.
“So there’s a lot of cashing in of the chips going on.”
Silver’s collapse was especially severe, which Yardeni attributed to thinner liquidity and greater leverage compared to gold — conditions that amplify forced selling once margin calls hit.
Warsh Isn’t A One-Note Hawk
Yardeni acknowledged that Warsh built a reputation as a hawk during the financial crisis, opposing zero interest rates and later rounds of quantitative easing. But he cautioned against freezing that view in time.
When examining Warsh’s more recent comments, Yardeni said the picture looks very different. Warsh has increasingly emphasized supply-side growth, productivity gains, and the deflationary potential of technological advances — especially artificial intelligence.
“He sounds much more like a supply-sider today,” Yardeni said. “That’s a very different framework than the one people remember from 2009.”
Importantly, Yardeni also reminded investors that Fed chairs are consensus builders. Even strong personalities tend to moderate their views once they sit at the head of the Federal Open Market Committee.
“We’ve never really had a Fed chair who was a lone dissenter,” he said. “They lead by persuasion, not by force.”
Why $6,000 Still Makes Sense
Yardeni’s gold outlook isn’t driven by a single macro fear. He readily admits he doesn’t have a traditional valuation model for gold — just as he doesn’t for Bitcoin(CRYPTO: BTC).
Instead, he frames gold as a portfolio stabilizer.
By plotting gold and the S&P 500 on the same chart using the same scale, Yardeni observes that the two tend to move inversely on a cyclical basis, even if their long-term trends align.
“That corroborates that gold is a good diversifier for a portfolio if you want to take some of the volatility out of the portfolio,” he said.
As equity markets rise, Yardeni believes diversification demand alone can support higher gold prices.
“As the stock market goes higher and higher, people feel a little bit less comfortable with it,” he said. “They don’t want to give it back.”
If the S&P 500 continues climbing toward 10,000 later this decade, Yardeni believes that diversification alone could push gold toward $10,000 as well — even without a recession or inflation shock.
The Bottom Line
In Yardeni’s view, last week’s precious-metals crash was a classic leverage unwind — not a verdict on monetary policy, Warsh, or the long-term gold story.
Volatility, he said, comes with meltups.
But for now, his message is clear: gold’s bull case is bruised, not broken — and $6,000 is still very much on the table.
The DBC ETF is already up 9% year-to-date. Check live prices here.
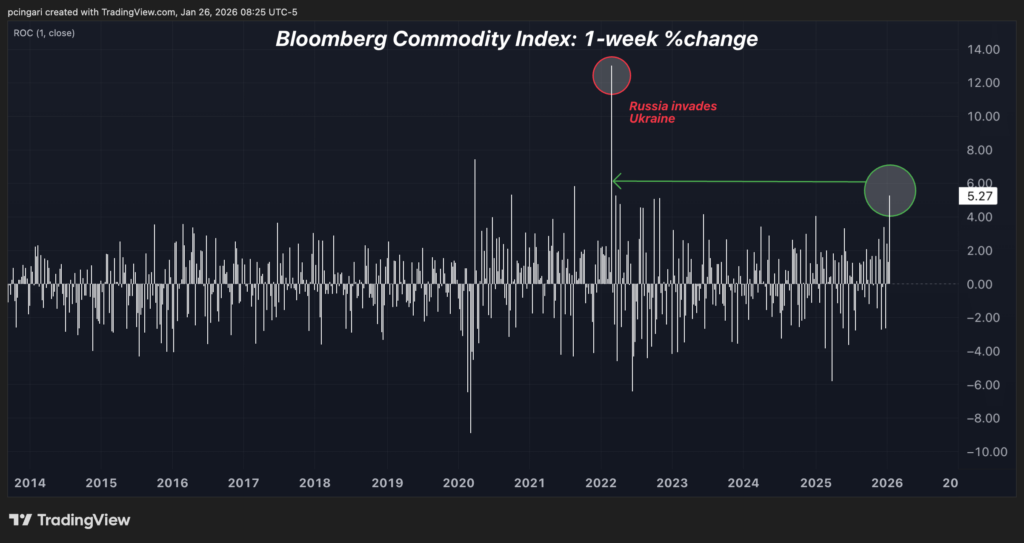
The Bloomberg Commodity Index — a closely watched benchmark tracking prices across 23 major commodities — posted its strongest weekly gain since February 2022, jumping 5.3% in the week that just ended. The rally marked a third consecutive weekly advance and pushed the index up by more than 9% year to date, outpacing the S&P 500.
The last time the index surged like this, Russia’s invasion of Ukraine had triggered a global energy shock. Crude oil vaulted above $100 a barrel, European natural gas prices exploded as Russian supply was cut off, and sweeping sanctions on the Kremlin sent commodity markets into chaos.
That post-pandemic rebound, combined with surging energy prices, led many Wall Street analysts to declare the return of a commodity supercycle reminiscent of the early 2000s.
But the thesis didn’t last.
Aggressive interest-rate hikes by global central banks quickly cooled demand, drained liquidity from financial markets, and pulled most commodity prices back from their extremes as the era of easy money came to an abrupt end.
Fast forward nearly four years, and a new commodity boom is unfolding — but this time, the epicenter looks very different.
Instead of oil and gas, the surge is being led by precious metals.
Gold prices — as tracked by the SPDR Gold Shares(NYSE:GLD) — topped $5,000 on Monday. Silver — tracked by the iShares Silver Trust(NYSE:SIL) — surged to nearly $110 per ounce.
Precious Metals Take Center Stage
Over the past year, silver is up 260%. Gold has climbed 85%. Both are on track for their strongest rolling 12-month returns since 1980.
“History is not a guide to the future, but the average increase in gold during four upward cycles was about 300% over 43 months, which means the gold price could reach $6000 by spring,” Michael Hartnett, chief investment strategist at Bank of America, said in a recent note.
Gold’s rally has been fueled by a weakening U.S. dollar, persistent geopolitical tensions, and rising concerns over political interference in Federal Reserve policy — forces that have drawn a new wave of private investors into the metal.
Silver’s story, however, may be even more complex.
“Silver has also been boosted by a historic short squeeze and strong retail buying. At the same time, industrial demand – particularly from solar, electrification, and grid infrastructure investment – has tightened the physical market at a time when mine supply growth remains limited,” said Ewa Manthey, commodities strategist at ING Group.
Why AI Is Changing The Silver Story
Silver is no longer just a precious metal. Its industrial role is becoming central to the artificial intelligence buildout.
“The global economy is not short of energy. Fossil fuels remain abundant. Renewable capacity continues to expand. From a purely volumetric perspective, there is no immediate energy scarcity,” said Jordi Visser, head of AI Macro Nexus research at 22V Research.
“But AI systems do not run on energy in the abstract. They run on electricity delivered with extreme precision, density, and reliability and that distinction is no longer academic,” he said.
“Electricity plays the same role in the physical world that memory plays in the digital one. It determines whether theoretical capacity can be turned into real performance,” Visser said.
“Silver sits precisely at this interface,” he added.
The Commodity Rally Is Now Spreading
The past week also delivered a reminder that energy markets haven’t gone quiet.
U.S. natural gas prices at the Henry Hub facility posted their largest one-week gain on record — surging roughly 70% — driven by a historic cold wave, heavy snowfall, and widespread ice storms across large parts of the country.
“The extreme conditions will boost heating demand and put energy infrastructure at risk,” warned ING’s Manthey on Monday.
“There will be stronger heating demand and supply hits, industrial demand could come under pressure, with some industrials reducing or temporarily halting operations due to weather conditions,” she added.
Copper could be next, with conditions aligning for a sustained and forceful bull run.
Industrial metals are already up about 40% over the past six months — their strongest run since 2021 — and some analysts believe the rally is only beginning.
Visser frames the broader macro picture as a clash between abundance and scarcity. Software has become ubiquitous. Code is cheap. AI-driven “vibe coding” is accelerating application development at record speed, while agentic AI threatens to disrupt traditional enterprise software models.
Critical minerals, however — including silver, copper, and rare earths — face structural shortages that could persist for more than a decade.
Nvidia Corp.(NASDAQ:NVDA) CEO Jensen Huang recently described the coming AI-driven infrastructure buildout as an $85 trillion opportunity. Bernstein projects copper shortages stretching into the 2040s.
That imbalance may keep commodities in the spotlight longer than many expect.