Pulled from Benzinga Pro data the above sector movers alert assists traders in understanding macro-level trends and market variations. Traders will look for sector movers providing information on sectors that are over- or under-performing, deriving these results into investing decisions on exchange-traded funds (ETFs) or individual tickers in those sectors.
German automaker Audi delivered around 1.7 million vehicles worldwide last year, marking a drop of about 12%, allowing American EV giant Tesla Inc. (NASDAQ:TSLA) to overtake it in global vehicle sales.
What Happened: Audi pinned the decline in overall deliveries to challenging economic conditions, a competitive market, and limited availability of parts.
Though the company launched new models, including all battery electric vehicles, in 2024, they are only gradually having an impact on global sales, the automaker said. The company witnessed a 21% decline in Germany, a 13% drop in North America, and an 11% drop in China.
Audi EV Sales: Out of its overall deliveries, over 164,000 were fully electric models, marking a decline of 8% as compared to 2023, the company said.
“Challenging economic conditions and the in transparency in terms of government incentive structures are currently causing a certain reluctance to buy affecting the entire industry, especially when it comes to fully electric vehicles,” Marco Schubert, Board Member for Sales and Marketing, said in a statement.
Why It Matters: While a fall in EV sales managed to drag Audi’s overall deliveries lower, Tesla overtook it in global vehicle deliveries by delivering about 1.79 million vehicles in 2024.
Tesla’s deliveries fell by about 1.1% in 2024 as compared to the 1,808,581 deliveries reported for 2023, marking its first fall in annual vehicle deliveries. However, the company still managed to overtake its rival and legacy brand Audi.
Tesla shared its achievement over Audi in a post on social media platform X and wrote, “Thank you to our owners around the world – you rock!”
A United Airlines Holdings (NASDAQ:UAL) analyst says the company could mirror recent earnings strength and guidance that Delta Air Lines (NYSE:DAL) had when the company reports fourth-quarter financial results on Jan. 21.
The United Airlines Analyst: Bank of America analyst Andrew Didora reiterated a Buy rating on United Airlines and raised the price target from $100 to $120.
The Analyst Takeaways: United Airlines could be the biggest winner from a strong outlook shared by Delta, Didora said in a new investor note.
“We expect UAL to report strong 4Q24 results and guide 1Q25 ahead of consensus when the company reports earnings on 1/21,” Didora said.
The analyst raised fourth quarter, first quarter and full year 2025 earnings per share estimates ahead of the earnings report.
“The airline is the biggest beneficiary of the strong premium, corporate, and transatlantic growth mentioned in DAL’s earnings report last week.”
Didora said United’s premium product offering and coastal hubs that see strong corporate share should see the airline company reporting results in line with Delta or better.
“The magnitude of DAL’s +7-9% 1Q25 revenue guide was a positive surprise to us, and this outlook was well ahead of our prior/Visible Alpha consensus 1Q25 revenue growth forecast of +6.0% for UAL.”
The analyst estimates UAL could see 7.5% year-over-year growth in the first quarter based on Delta’s report.
“We are modeling consistent unit revenue growth throughout 2025 of around 3% for total revenue growth of +7.6%.”
The analyst said the new forecast should allow United to see both higher earnings and free cash flow, allowing the company to complete its buyback and see “further de-leveraging.”
UAL Price Action: United Airlines stock is down 3.32% to $103.52 at publication Monday versus a 52-week trading range of $37.02 to $110.92. United Airlines stock is up 164% over the last year.
Analysts expect the Winona, Minnesota-based company to report quarterly earnings at 48 cents per share, up from 46 cents per share in the year-ago period. Fastenal projects quarterly revenue of $1.84 billion, compared to $1.76 billion a year earlier, according to data from Benzinga Pro.
On Dec. 11, Stifel analyst Brian Butler downgraded Fastenal from Buy to Hold and maintained the price target of $86.
With the recent buzz around Fastenal, some investors may be eyeing potential gains from the company’s dividends too. Fastenal offers an annual dividend yield of 2.18%, which is a quarterly dividend amount of 39 cents per share ($1.56 a year).
So, how can investors exploit its dividend yield to pocket a regular $500 monthly?
To earn $500 per month or $6,000 annually from dividends alone, you would need an investment of approximately $275,489 or around 3,846 shares. For a more modest $100 per month or $1,200 per year, you would need $55,083 or around 769 shares.
To calculate: Divide the desired annual income ($6,000 or $1,200) by the dividend ($1.56 in this case). So, $6,000 / $1.56 = 3,846 ($500 per month), and $1,200 / $1.56 = 769 shares ($100 per month).
Note that dividend yield can change on a rolling basis, as the dividend payment and the stock price both fluctuate over time.
How that works: The dividend yield is computed by dividing the annual dividend payment by the stock’s current price.
For example, if a stock pays an annual dividend of $2 and is currently priced at $50, the dividend yield would be 4% ($2/$50). However, if the stock price increases to $60, the dividend yield drops to 3.33% ($2/$60). Conversely, if the stock price falls to $40, the dividend yield rises to 5% ($2/$40).
Similarly, changes in the dividend payment can impact the yield. If a company increases its dividend, the yield will also increase, provided the stock price stays the same. Conversely, if the dividend payment decreases, so will the yield.
Price Action: Shares of Fastenal fell 1.8% to close at $71.63 on Friday.
Pulled from Benzinga Pro data this sector movers alerts can help traders understand macro-level market trends. Traders often look for sector movers to provide high-level analysis on which sectors are over- or under-performing to make better investing decisions on exchange traded funds (ETFs) or individual tickers in those sectors.
The most oversold stocks in the materials sector presents an opportunity to buy into undervalued companies.
The RSI is a momentum indicator, which compares a stock’s strength on days when prices go up to its strength on days when prices go down. When compared to a stock’s price action, it can give traders a better sense of how a stock may perform in the short term. An asset is typically considered oversold when the RSI is below 30, according to Benzinga Pro.
Here’s the latest list of major oversold players in this sector, having an RSI near or below 30.
On Dec. 9, MP Materials announced exchanges of a portion of its 0.25% green convertible senior notes due 2026, representing a net reduction of $25 million of outstanding indebtedness. The company’ stock fell around 1% over the past month and has a 52-week low of $10.02.
RSI Value: 29.9
MP Price Action: Shares of MP closed at $19.38 on Wednesday.
Benzinga Pro’s real-time newsfeed alerted to latest MP news.
On Jan. 7, Raymond James analyst Matt Roberts initiated coverage on AptarGroup with an Outperform rating and announced a price target of $200. The company’s stock fell around 10% over the past month and has a 52-week low of $124.94.
RSI Value: 28.6
ATR Price Action: Shares of Aptargroup closed at $154.15 on Wednesday.
Benzinga Pro’s charting tool helped identify the trend in ATR stock.
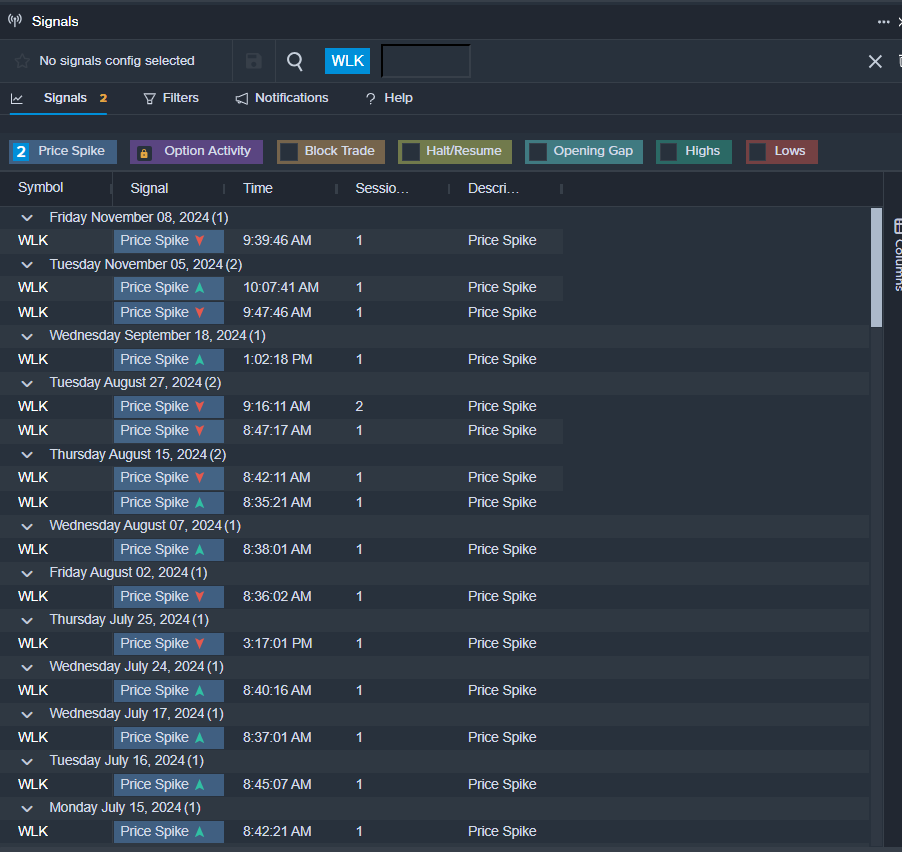
On Jan. 7, Piper Sandler analyst Charles Neivert maintained Westlake with an Overweight and lowered the price target from $155 to $135.. The company’s stock fell around 10% over the past month and has a 52-week low of $108.95.
RSI Value: 19.8
WLK Price Action: Shares of Westlake fell 0.1% to close at $110.54 on Wednesday.
Benzinga Pro’s signals feature notified of a potential breakout in WLK shares.
Pulled from Benzinga Pro data this sector movers alert provides traders with a compiled way to read macro-level market trends. Investors garner a particular interest in sector movers to better determine sectors that are over- or under-performing to make better investing decisions on exchange-traded funds (ETFs) or individual tickers in those sectors.
Dogecoin (CRYPTO: DOGE) is seeing a disparity between bearish short-term price action and bullish social media sentiment driven rising social activity and increased accumulation by large holders.
Trader Notes: Trader Tardigrade compared Dogecoin’s current price pattern to its previous market cycle, highlighting the formation of a parallel channel suggesting a bullish outlook.
He set price targets of $2 for the 2025 cycle and $8 for 2028, advising long-term holding for substantial gains.
#Dogecoin is REPLICATING its previous cycle The same parallel lines (Channel) has been identified. This is no coincidence. $2 is a reasonable target for the 2025 cycle, and $8 for the 2028 cycle Hodl your $Dogepic.twitter.com/ii0FzyL3BB
In another tweet on Jan. 8, he said this is not the time to short or sell DOGE, as it is retesting the apex of the Ascending Triangle.
Rose Premium Signals echoed the sentiment, noting a strong bullish structure in Dogecoin’s macro charts.
Accumulation near key support zones aligns with long-term Fibonacci levels, supporting a potential 3x rally this cycle to approximately $0.56943.
Statistics: Coinglass data shows $18.8 million in Dogecoin liquidations over the past 24 hours, including $12.3 million in long positions.
According to Bitinfocharts, addresses holding 1 billion to 10 billion DOGE have increased from 13 to 17 in recent weeks.
Between Dec. 1, 2024, and Jan. 9, these addresses grew their holdings from 28.4 billion DOGE to 45.6 billion DOGE.
CryptoDep data places Dogecoin at the top of the meme token leaderboard, with 28.500 posts, 6.9 million interactions and 2.9% social dominance.
Community News: Dogecoin founder Billy Markus, pseudonymously known as Shibetoshi Nakamoto, highlighted DOGE’s surprising appearance in Senator Joni Ernst’s (R-Iowa) speech.
She referenced DOGE in her address on the newly established Department of Government Efficiency, emphasizing its symbolic importance and stating, “Doge is inevitable.”
No gainer in today’s Pre-market session.
No loser in today’s Pre-market session.
Pulled from Benzinga Pro data this sector movers alert provides traders with a compiled way to read macro-level market trends. Investors garner a particular interest in sector movers to better determine sectors that are over- or under-performing to make better investing decisions on exchange-traded funds (ETFs) or individual tickers in those sectors.
For more information on sector movers, click here.
Is Trump Media & Technology Group Corp. (NASDAQ:DJT) stock climbing on optimism or concrete signals? The stock has surged 104% over the past year, with its rally appearing to align with President-elect Donald Trump‘s upcoming return to the White House.
But will the momentum last?
Technical Tea Leaves: Bullish, With A Dash Of Bear Risk
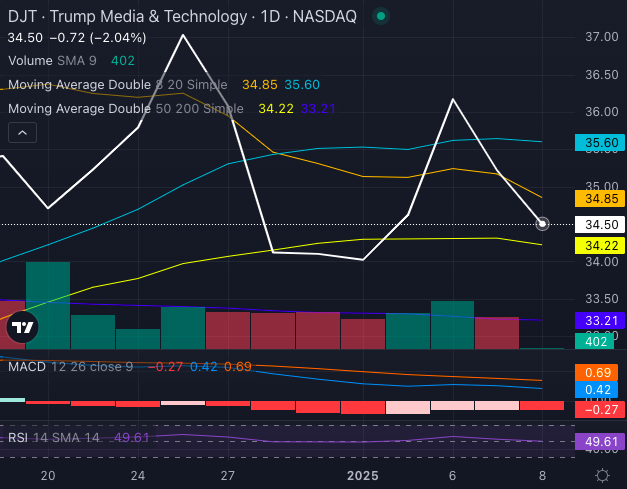
DJT stock, at $34.50, trades above its five, 20 and 50-day exponential moving averages, signaling a bullish outlook. Key indicators paint a mixed picture:
Eight-Day SMA (simple moving average) Bearish Signal: At $34.85, it’s just above the stock price, hinting at short-term bearishness.
20-Day SMA Bearish Signal: DJT is trading below the $35.60 level, sparking concerns about overextension.
50 and 200-Day SMA Bullish: At $34.22 and $33.21 respectively, these moving averages support the bullish case.
MACD at 0.42: Another bullish indicator, showing positive momentum.
RSI at 49.61: The stock isn’t overheated but inching toward neutral territory, reflecting a balance of buying and selling pressure.
Still, selling pressure could soon weigh on DJT, indicating a risk of bearish movement ahead.
Impact Of Courtroom Battles
Tuesday saw DJT stock dip slightly, following a New York court denying Trump’s immunity plea in his felony case. The judge’s ruling solidified Trump’s Jan. 10 sentencing date, just days before his presidential inauguration on Jan. 20.
The case stems from a $130,000 hush money payment in the 2016 election cycle, with Trump already convicted of 34 felony counts for falsifying business records.
Despite legal hurdles, Trump Media’s parent stock has remained resilient, buoyed by advertising revenue on its Truth Social platform and investor optimism about Trump’s 2025 inauguration.
Is DJT Stock’s Rally Worth Watching?
DJT’s performance might feel like a rally in lockstep with Trump’s political fortunes. While technical indicators lean bullish, the stock faces headwinds—court rulings, selling pressure, and recent dips hint at volatility ahead.
For investors, DJT presents a speculative opportunity worth monitoring closely, trading above key averages amid its inauguration rally, though ongoing legal and political developments add uncertainty to its trajectory.