Analysts expect the company to report quarterly earnings of $1.5 per share. That’s down from $1.73 per share in the year-ago period. The consensus estimate for Texas Roadhouse’s quarterly revenue is $1.5 billion (it reported $1.44 billion last year), according to Benzinga Pro.
Ahead of quarterly earnings, Mizuho analyst Nick Setyan, on Feb. 12, maintained Texas Roadhouse with an Outperform rating and raised the price target from $190 to $200.
With the recent buzz around Texas Roadhouse, some investors may be eyeing potential gains from the company’s dividends too. As of now, the company has an annual dividend yield of 1.46%. That’s a quarterly dividend amount of 68 cents per share ($2.72 a year).
So, how can investors exploit its dividend yield to pocket a regular $500 monthly?
To earn $500 per month or $6,000 annually from dividends alone, you would need an investment of approximately $412,235 or around 2,206 shares. For a more modest $100 per month or $1,200 per year, you would need $82,410 or around 441 shares.
To calculate: Divide the desired annual income ($6,000 or $1,200) by the dividend ($2.72 in this case). So, $6,000 / $2.72 = 2,206 ($500 per month), and $1,200 / $2.72 = 441 shares ($100 per month).
Note that dividend yield can change on a rolling basis, as the dividend payment and the stock price both fluctuate over time.
How that works: The dividend yield is computed by dividing the annual dividend payment by the stock’s current price.
For example, if a stock pays an annual dividend of $2 and is currently priced at $50, the dividend yield would be 4% ($2/$50). However, if the stock price increases to $60, the dividend yield drops to 3.33% ($2/$60). Conversely, if the stock price falls to $40, the dividend yield rises to 5% ($2/$40).
Similarly, changes in the dividend payment can impact the yield. If a company increases its dividend, the yield will also increase, provided the stock price stays the same. Conversely, if the dividend payment decreases, so will the yield.
TXRH Price Action: Shares of Texas Roadhouse fell slightly to close at $186.87 on Wednesday.
As of Oct. 17, 2025, two stocks in the industrials sector could be flashing a real warning to investors who value momentum as a key criteria in their trading decisions.
The RSI is a momentum indicator, which compares a stock’s strength on days when prices go up to its strength on days when prices go down. When compared to a stock’s price action, it can give traders a better sense of how a stock may perform in the short term. An asset is typically considered overbought when the RSI is above 70, according to Benzinga Pro.
Here’s the latest list of major overbought players in this sector.
On Aug. 5, Powell Industries reported mixed third-quarter financial results. Brett A. Cope, Powell’s Chairman and Chief Executive Officer, said, “I am very proud of the Powell team as we delivered another strong quarter of results. We continue to execute our project backlog at a high level, achieving a gross margin of 30.7% in the current quarter, an improvement of 230 basis points compared to the prior year. Our strong brand of trusted execution supports another quarter of robust order activity highlighted by a book-to-bill ratio of 1.3x and sequential backlog growth of 7%.” The company’s stock gained around 16% over the past month and has a 52-week high of $364.98.
RSI Value: 71.2
POWL Price Action: Shares of Powell Industries gained 2.6% to close at $338.32 on Thursday.
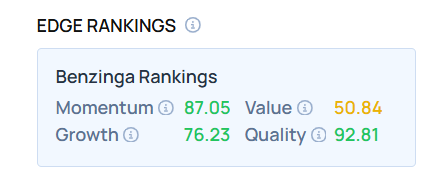
Edge Stock Ratings: 87.05 Momentum score with Value at 50.84.
On Oct. 9, Lake Street analyst Mark Smith maintained Cadre with a Buy and raised the price target from $41 to $43. The company’s stock gained around 25% over the past month and has a 52-week high of $42.06.
RSI Value: 78.4
CDRE Price Action: Shares of Cadre rose 1% to close at $40.99 on Thursday.
As of Oct. 16, 2025, two stocks in the health care sector could be flashing a real warning to investors who value momentum as a key criteria in their trading decisions.
The RSI is a momentum indicator, which compares a stock’s strength on days when prices go up to its strength on days when prices go down. When compared to a stock’s price action, it can give traders a better sense of how a stock may perform in the short term. An asset is typically considered overbought when the RSI is above 70, according to Benzinga Pro.
Here’s the latest list of major overbought players in this sector.
On Aug. 4, Cellectis posted better-than-expected quarterly results. “I am pleased to announce that Cellectis will host an Investor R&D Day in New York City on October 16, 2025. The Company’s leadership team and key opinion leaders will present the Phase 1 dataset and outline the late-stage development strategy for lasme-cel (UCART22) in r/r B-ALL and will share insights on the Company’s vision and differentiated capabilities,” said André Choulika, Ph.D., Chief Executive Officer at Cellectis. The company’s stock gained around 30% over the past month and has a 52-week high of $4.59.
RSI Value: 70.9
CLLS Price Action: Shares of Cellectis fell 1.4% to close at $4.11 on Wednesday.
On Sept. 26, Concord Medical Services posted a H1 loss of 3 cents per share on sales of $28.005 million. Dr. Jianyu Yang, Chairman and Chief Executive Officer of Concord Medical, said, “The precision of proton therapy helps prevent long-term damage to critical functional areas—including the brain, heart, and rectum—while allowing clinicians to safely escalate radiation doses to target sites to improve efficacy in refractory cancers. With minimal impact on surrounding normal tissues, patients benefit from fewer side effects and faster recovery, making proton therapy an optimal treatment option in cases where balancing efficacy and safety is critical.” The company’s stock gained around 19% over the past five days and has a 52-week high of $10.77.
RSI Value: 77.4
CCM Price Action: Shares of Concord Medical Services rose 14.8% to close at $6.90 on Wednesday.
As of Oct. 10, 2025, two stocks in the communication services could be flashing a real warning to investors who value momentum as a key criteria in their trading decisions.
The RSI is a momentum indicator, which compares a stock’s strength on days when prices go up to its strength on days when prices go down. When compared to a stock’s price action, it can give traders a better sense of how a stock may perform in the short term. An asset is typically considered overbought when the RSI is above 70, according to Benzinga Pro.
Here’s the latest list of major overbought players in this sector.
On Oct. 3, Conekt.ai and Globalstar announced collaboration to deliver private, public, and satellite IoT connectivity services. “This partnership represents an expansion of our go-to-market capabilities, bringing Band 53 spectrum and XCOM RAN solutions to Conekt.ai’s device orchestration platform and established customer base across IoT and enterprise markets,” said Tamer Kadous, General Manager of Globalstar Terrestrial Networks. The company’s stock gained around 51% over the past month and has a 52-week high of $47.32.
RSI Value: 80.5
GSAT Price Action: Shares of Globalstar gained 3.4% to close at $47.06 on Thursday.
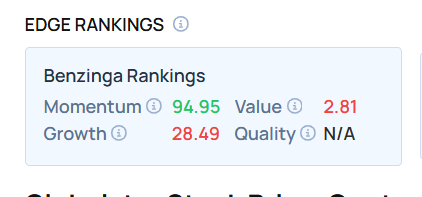
Edge Stock Ratings: 94.95 Momentum score with Value at 2.81.
On Sept. 29, Electronic Arts agreed to be acquired in a $55 billion all-cash deal. A consortium led by Saudi Arabia’s Public Investment Fund (PIF), Silver Lake, and Affinity Partners. The investor group will buy 100% of EA, with PIF rolling over its existing 9.9% stake, in a record all-cash sponsor take-private deal. The company’s stock gained around 17% over the past month and has a 52-week high of $203.75.
RSI Value: 75.3
EA Price Action: Shares of Electronic Arts rose 0.02% to close at $200.05 on Thursday.
The most oversold stocks in the consumer staples sector presents an opportunity to buy into undervalued companies.
The RSI is a momentum indicator, which compares a stock’s strength on days when prices go up to its strength on days when prices go down. When compared to a stock’s price action, it can give traders a better sense of how a stock may perform in the short term. An asset is typically considered oversold when the RSI is below 30, according to Benzinga Pro.
Here’s the latest list of major oversold players in this sector, having an RSI near or below 30.
On Sept. 11, National Beverage posted weaker-than-expected quarterly sales. “Our solid operating performance amid the challenging global environment, marked by uncertainty in consumer spending and geopolitical events, reflects the strength of our brands and the success of Team National’s management strategy. We continue to generate exceptional operating cash flows while maintaining one of the strongest balance sheets among our beverage peers,” as stated by a company spokesperson. The company’s stock fell around 10% over the past month and has a 52-week low of $36.27.
RSI Value: 28.6
FIZZ Price Action: Shares of National Beverage gained 0.1% to close at $36.92 on Tuesday.
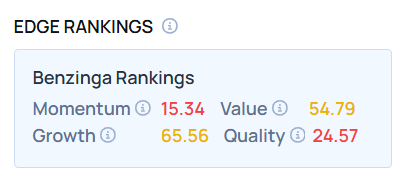
Edge Stock Ratings: 15.34 Momentum score with Value at 54.79.
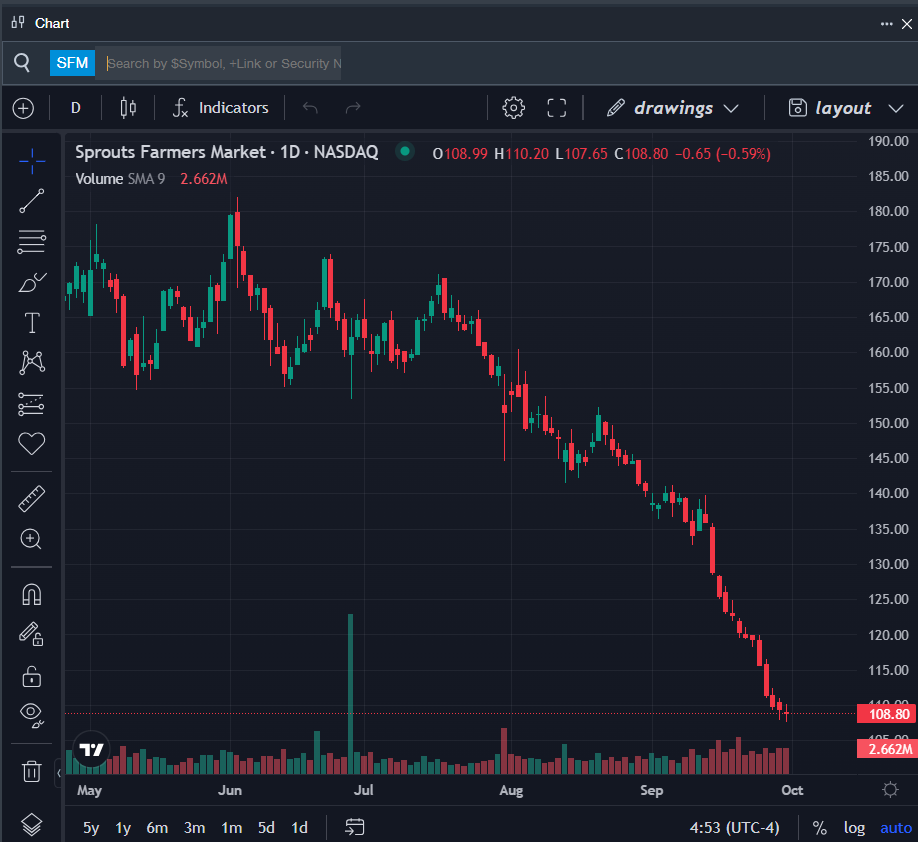
On Aug. 19, Sprouts Farmers Market announced a $1 billion share repurchase authorization. The company’s stock fell around 22% over the past month and has a 52-week low of $107.65.
RSI Value: 13.6
SFM Price Action: Shares of Sprouts Farmers Market fell 0.6% to close at $108.80 on Tuesday.
Benzinga Pro’s charting tool helped identify the trend in SFM stock.
On Aug. 5, J&J Snack Foods posted upbeat quarterly earnings. Dan Fachner, J&J Snack Foods Chairman, President, and CEO said, “We delivered strong third quarter results, achieving record performance across key financial metrics, including net sales of $454.3 million and adjusted EBITDA of $72.0 million. These results reflect the resilience of our business, the strength of our diversified portfolio, the continued appeal of our brands, and our team’s relentless focus on disciplined execution in the face of a cautious consumer environment and weather-related headwinds.” The company’s stock fell around 12% over the past month and has a 52-week low of $94.13.
RSI Value: 28.4
JJSF Price Action: Shares of J&J Snack Foods rose 0.2% to close at $96.09 on Tuesday.
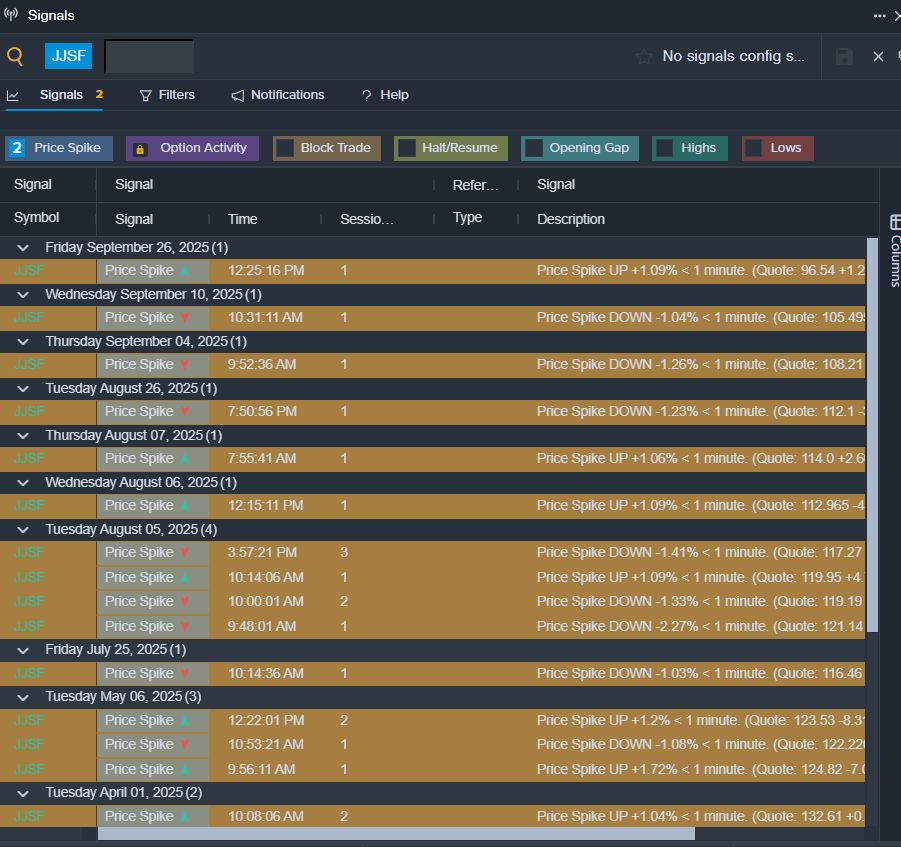
Benzinga Pro’s signals feature notified of a potential breakout in JJSF shares.
Nike, Inc. (NYSE:NKE) will release earnings results for the first quarter, after the closing bell on Tuesday, Sept. 30.
Analysts expect the apparel maker to report quarterly earnings at 27 cents per share. That’s down from 70 cents per share in the year-ago period. Lamb Weston projects to report quarterly revenue at $11.00 billion. A year earlier, Nike reported $11.59 billion, according to data from Benzinga Pro.
The company has beaten analyst estimates for revenue in three consecutive quarters and in six of the last 10 quarters overall.
With the recent buzz around Nike, some investors may be eyeing potential gains from the company’s dividends too. As of now, Nike offers an annual dividend yield of 2.31%, which is a quarterly dividend amount of 40 cents per share ($1.60 a year).
To figure out how to earn $500 monthly from Nike, we start with the yearly target of $6,000 ($500 x 12 months).
Next, we take this amount and divide it by Nike’s $1.60 dividend: $6,000 / $1.60 = 3,750 shares.
So, an investor would need to own approximately $260,813 worth of Nike, or 3,750 shares to generate a monthly dividend income of $500.
Assuming a more conservative goal of $100 monthly ($1,200 annually), we do the same calculation: $1,200 / $1.60 = 750 shares, or $52,163 to generate a monthly dividend income of $100.
Note that dividend yield can change on a rolling basis, as the dividend payment and the stock price both fluctuate over time.
The dividend yield is calculated by dividing the annual dividend payment by the current stock price. As the stock price changes, the dividend yield will also change.
For example, if a stock pays an annual dividend of $2 and its current price is $50, its dividend yield would be 4%. However, if the stock price increases to $60, the dividend yield would decrease to 3.33% ($2/$60).
Conversely, if the stock price decreases to $40, the dividend yield would increase to 5% ($2/$40).
Further, the dividend payment itself can also change over time, which can also impact the dividend yield. If a company increases its dividend payment, the dividend yield will increase even if the stock price remains the same. Similarly, if a company decreases its dividend payment, the dividend yield will decrease.
NKE Price Action: Shares of Nike gained by 0.4% to close at $69.55 on Monday.
U.S. stock futures were higher this morning, with the Dow futures gaining more than 100 points on Monday.
Shares of Inventiva ADR (NASDAQ: IVA) fell sharply in today’s pre-market trading following H1 results.
Inventiva reported losses of $(1.84) per share compared to the analyst consensus estimate of loss of 41 cents per share. The company reported quarterly sales of $5.050 million which missed the analyst consensus estimate of $5.310 million.
Inventiva shares dipped 5.5% to $5.72 in pre-market trading.
Here are some other stocks moving lower in pre-market trading.
MoonLake Immunotherapeutics (NASDAQ: MLTX) dipped 86.3% to $8.50 in pre-market trading. MoonLake’s Phase 3 VELA trials showed Sonelokimab achieved statistically significant HiSCR75 responses in moderate to severe hidradenitis suppurativa.
Cellectis SA (NASDAQ: CLLS) declined 10.4% to $3.01 in pre-market trading.
Quantum-Si Inc (NASDAQ: QSI) fell 10.1% to $1.34 in pre-market trading. Quantum-Si filed for mixed shelf of up to $300 million.
Penguin Solutions Inc (NASDAQ: PENG) fell 8.4% to $24.00 in pre-market trading.
Lithium Americas Corp (NYSE: LAC) declined 5.4% to $5.99 in pre-market trading after dipping 14% on Monday.
Platinum Analytics Cayman Ltd (NASDAQ: PLTS) fell 5.3% to $16.20 in pre-market trading after jumping 44% on Monday.
Novo Nordisk A/S (NYSE: NVO) fell 2.9% to $54.01 in pre-market trading.
Lexicon Pharmaceuticals Inc (NASDAQ: LXRX) declined 2.9% to $1.36 in pre-market trading. Lexicon Pharmaceuticals recently announced an update on submission of additional data to U.S. FDA supporting the benefit-risk profile of Zynquista® in Type 1 Diabetes.
As of Sept. 29, 2025, three stocks in the consumer staples sector could be flashing a real warning to investors who value momentum as a key criteria in their trading decisions.
The RSI is a momentum indicator, which compares a stock’s strength on days when prices go up to its strength on days when prices go down. When compared to a stock’s price action, it can give traders a better sense of how a stock may perform in the short term. An asset is typically considered overbought when the RSI is above 70, according to Benzinga Pro.
Here’s the latest list of major overbought players in this sector.
On July 10, PriceSmart reported better-than-expected third-quarter financial results. The company’s stock gained around 13% over the past month and has a 52-week high of $121.50.
RSI Value: 73
PSMT Price Action: Shares of PriceSmart gained 3.4% to close at $120.94 on Friday.
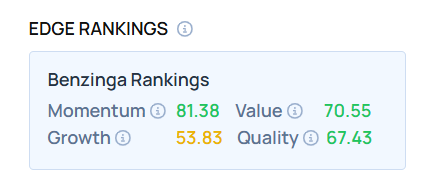
Edge Stock Ratings: 81.38 Momentum score with Value at 70.55.
On Sept. 25, BMO Capital analyst Kelly Bania upgraded United Natural Foods from Market Perform to Outperform and raised the price target from $25 to $36. The company’s stock gained around 12% over the past month and has a 52-week high of $34.76.
RSI Value: 70.6
UNFI Price Action: Shares of United Natural Foods gained 4.7% to close at $31.62 on Friday.
On July 3, Empro Group announced the closing of its upsized $5.5 million initial public offering. The company’s stock gained around 61% over the past month and has a 52-week high of $16.88.
RSI Value: 82.2
EMPG Price Action: Shares of Empro Group gained 6.4% to close at $16.88 on Friday.
Top Wall Street analysts changed their outlook on these top names. For a complete view of all analyst rating changes, including upgrades and downgrades, please see our analyst ratings page.
Needham raised Monolithic Power Systems Inc (NASDAQ: MPWR) price target from $820 to $1,025. Needham analyst N. Quinn Bolton maintained a Buy rating. Monolithic Power shares closed at $887.55 on Friday. See how other analysts view this stock.
Deutsche Bank raised the price target for Lam Research Corp (NASDAQ: LRCX) from $100 to $150. Deutsche Bank analyst Melissa Weathers upgraded the stock from Hold to Buy. Lam Research shares closed at $128.33 on Friday. See how other analysts view this stock.
BTIG boosted Bloom Energy Corp (NYSE: BE) price target from $42 to $80. BTIG analyst Gregory Lewis maintained a Buy rating. Bloom Energy shares closed at $70.32 on Friday. See how other analysts view this stock.
Freedom Capital Markets raised the price target for Electronic Arts Inc (NASDAQ: EA) from $185 to $195. Freedom Capital Markets analyst Nick McKay downgraded the stock from Buy to Hold. Electronic Arts shares closed at $193.35 on Friday. See how other analysts view this stock.
Canaccord Genuity raised the price target for Cipher Mining Inc (NASDAQ: CIFR) from $12 to $16. Canaccord Genuity analyst Joseph Vafi maintained a Buy rating. Cipher Mining shares closed at $11.47 on Friday. See how other analysts view this stock.
Rosenblatt boosted Seagate Technology Holdings PLC (NASDAQ: STX) price target from $200 to $250. Rosenblatt analyst Kevin Cassidy maintained a Buy rating. Seagate shares settled at $217.51 on Friday. See how other analysts view this stock.
Goldman Sachs raised Ford Motor Co (NYSE: F) price target from $11 to $12. Goldman Sachs analyst Mark Delaney maintained a Neutral rating. Ford shares closed at $12.01 on Friday. See how other analysts view this stock.
Rosenblatt raised Western Digital Corp (NASDAQ: WDC) price target from $90 to $125. Rosenblatt analyst Kevin Cassidy maintained a Buy rating. Western Digital shares closed at $106.88 on Friday. See how other analysts view this stock.
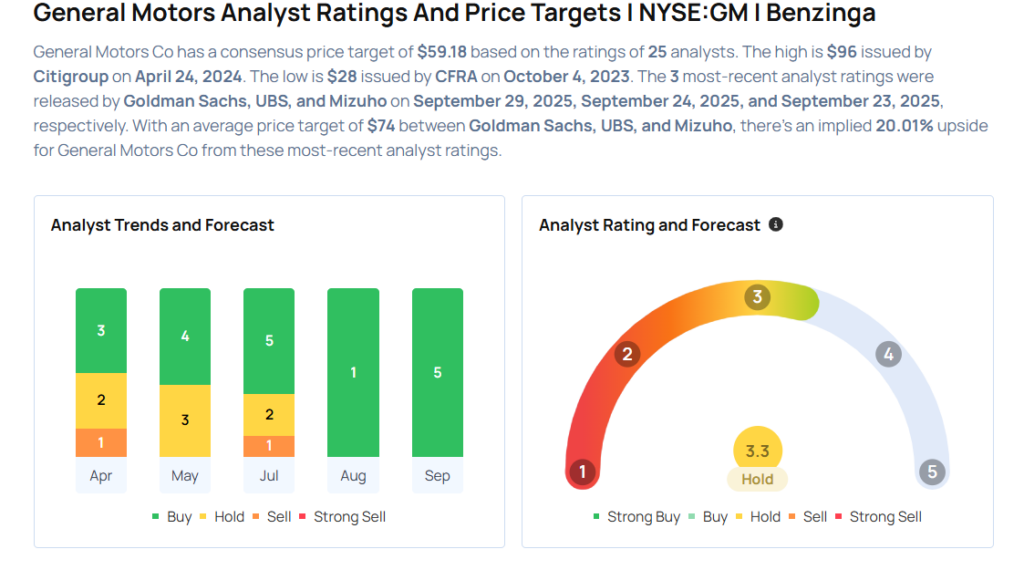
Goldman Sachs raised the price target for General Motors Co (NYSE: GM) from $70 to $74. Goldman Sachs analyst Mark Delaney maintained a Buy rating. GM shares settled at $61.24 on Friday. See how other analysts view this stock.
Keefe, Bruyette & Woods raised Willis Towers Watson PLC (NASDAQ: WTW) price target from $366 to $372. Keefe, Bruyette & Woods analyst Meyer Shields maintained an Outperform rating. Willis Towers Watson shares closed at $341.89 on Friday. See how other analysts view this stock.
Considering buying GM stock? Here’s what analysts think:
Top Wall Street analysts changed their outlook on these top names. For a complete view of all analyst rating changes, including upgrades, downgrades and initiations, please see our analyst ratings page.
Wedbush analyst Alicia Reese downgraded Electronic Arts Inc (NASDAQ: EA) from Outperform to Neutral and cut the price target from $210 to $200. Electronic Arts shares closed at $193.35 on Friday. See how other analysts view this stock.
BTIG analyst Julian Harrison downgraded MoonLake Immunotherapeutics (NASDAQ: MLTX) from Buy to Neutral and maintained the price target of $85. MoonLake shares closed at $61.99 on Friday. See how other analysts view this stock.
Freedom Capital Markets analyst Nick McKay downgraded Electronic Arts Inc (NASDAQ: EA) from Buy to Hold but raised the price target from $185 to $195. Electronic Arts shares closed at $193.35 on Friday. See how other analysts view this stock.
Morgan Stanley analyst Thibault Boutherin downgraded Novo Nordisk A/S (NYSE: NVO) from Equal-Weight to Underweight and cut the price target from $59 to $47. Novo Nordisk shares closed at $55.61 on Friday. See how other analysts view this stock.
Seaport Global analyst Glenn Chin downgraded Carmax Inc (NYSE: KMX) from Buy to Neutral. CarMax shares closed at $44.86 on Friday. See how other analysts view this stock.
Considering buying CHWY stock? Here’s what analysts think: