Visa Inc (NYSE:V) remains the undisputed scale leader in the payments industry, but Mastercard Inc (NYSE:MA) has been outpacing its rival in growth.
Should investors bet on Visa’s dominance or Mastercard’s momentum?
JPMorgan’s Tien-tsin Huang analyzes the key differences between the two payment giants, focusing on their financials, shareholder returns, and valuation dynamics.
Scale Vs. Speed: Who Wins?
Visa’s dominance is clear — it boasts 63% more total volume, 31% more revenue, and an enviable ten-point operating margin advantage, thanks to superior fixed cost leverage. It also has 50% more cards outstanding and commands nearly two-thirds of the global market share in purchase volume.
However, Mastercard has been running circles around Visa in growth, capitalizing on a mix of faster-expanding regions and revenue streams. According to Huang, Mastercard outpaced Visa in revenue growth by about two percentage points, maintaining its five-year average edge. Even on the bottom line, Mastercard’s adjusted EPS grew four percentage points faster, thanks to margin expansion—something Visa couldn’t pull off last year.
Both companies are cash flow powerhouses, returning nearly all of their adjusted net income to shareholders via aggressive share buybacks. In 2024, Mastercard and Visa shares gained 23% and 21%, respectively, mirroring the S&P 500’s performance.
However, Huang notes that Visa has taken the early lead in 2025, benefiting from investors’ appetite for U.S. growth and a reduced regulatory overhang.
The Valuation Puzzle
Network multiples have expanded, with Mastercard trading at 33x forward earnings versus Visa’s 28x.
While both remain in line with their historical premium to the S&P 500, Huang points out that Mastercard’s higher multiple reflects its stronger growth profile, while Visa’s relative value case is gaining traction.
The Verdict
Huang isn’t picking sides, maintaining an Overweight rating on both stocks. Mastercard’s growth premium looks sustainable, but Visa’s relative value and easing regulatory risks could make it the safer bet.
Investors have a choice—go big with Visa or go fast with Mastercard. Either way, it’s a battle of titans worth watching.
BP plc (NYSE:BP) is flashing strong technical signals, with bullish momentum building just as the stock approaches a Golden Cross — a classic indicator of potential upside.
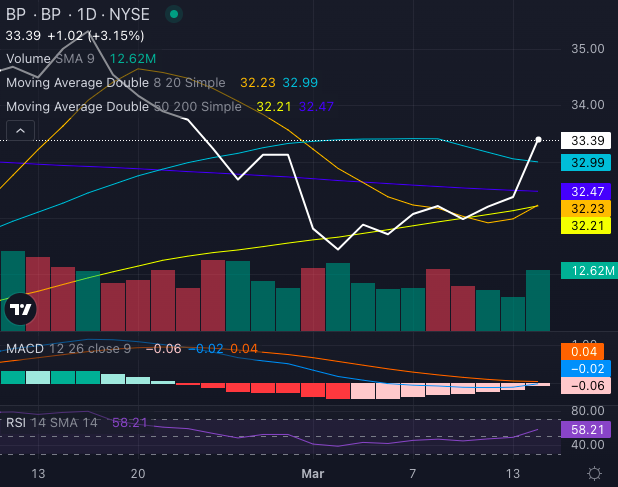
The oil giant’s stock, at $33.39, sits above its five-day, 20-day, 50-day and 200-day simple moving averages.
A golden cross occurs when the 50-day simple moving average moves above the 200-day simple moving average, often signaling a shift into sustained bullish territory. BP stock’s 50-day moving average of $32.21 is rapidly gaining on its 200-day average of $32.47. With buying pressure evident across multiple timeframes, the setup suggests that BP stock’s recent momentum could have more room to run.
While momentum indicators support the Golden Cross formation and bullishness, the oscillators indicator some weakness. BP stock’s Moving Average Convergence Divergence (MACD) sits at a negative 0.02 – a bearish signal, and the Relative Strength Index (RSI) stands at 58.21 – approaching overbought territory but still allowing room for additional gains.
Beyond the technical setup, BP’s latest move into offshore wind development could be a catalyst. The company recently announced a 50-50 joint venture with Jera Co. Inc., a Japanese utility giant, to fast-track offshore wind projects across Europe, Asia-Pacific, and the U.S.
With a projected net generating capacity of 13 gigawatts, the partnership positions BP as a key player in the global energy transition.
BP’s decision to explore selling its Castrol lubricants business, potentially fetching $10 billion, could further strengthen its balance sheet—a point of concern relative to its peers.
While recent earnings disappointed, with revenue missing estimates, investors may be betting on long-term strategic shifts rather than short-term setbacks.
Investor Takeaway
A golden cross would cement BP’s transition into a more sustained bullish phase. This offers an entry point for those eyeing technical breakouts.
However, with RSI approaching overbought territory, traders should watch for potential near-term pullbacks before a stronger move higher.
If BP successfully executes its wind energy strategy and shores up its financials, the stock could see extended gains beyond this bullish technical formation.
Gold prices have skyrocketed, surging over 50% in just 14 months to hit fresh all-time highs. The metal’s market cap has now crossed a jaw-dropping $20 trillion — a first in history.
Gold Defies Gravity
What’s unusual this time? Gold is climbing alongside the U.S. dollar and bond yields—a rare divergence that’s raising eyebrows across Wall Street, reported The Kobeissi Letter.
Furthermore, physical gold buying is SKYROCKETING.
Gold inventories in the 3 largest COMEX gold vaults just surged by 15 MILLION ounces in 2 months.
What was also noted is that physical gold buying is off the charts. Inventories in the three largest COMEX vaults spiked by 15 million ounces in just two months—a 115% surge that pushed holdings above 2020 pandemic levels.
Meanwhile, China’s gold reserves hit a record $73.5 billion, while India’s reached $70.9 billion. Central banks worldwide are piling in, with 2024 marking the third consecutive year of 1,000+ tonnes in net gold purchases—an unprecedented streak, The Kobeissi Letter notes.
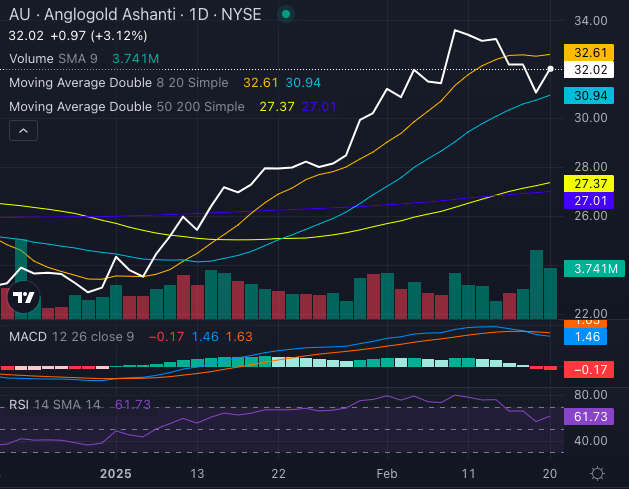
Anglogold Ashanti PLC (NYSE:AU) just formed a golden cross, where its 50-day moving average crossed above its 200-day. AU’s share price of $32.02 sits well above both its 50-day SMA of $27.37 and 200-day SMA of $27.01, signaling bullish momentum.
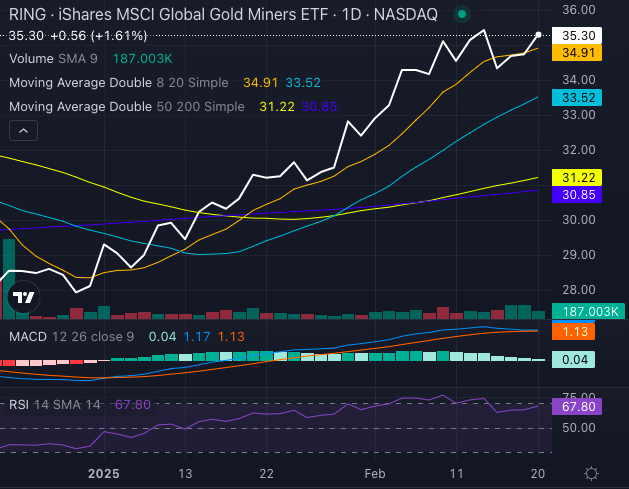
The iShares MSCI Global Gold Miners ETF (NASDAQ:RING) also triggered a golden cross. Currently trading at $35.30, RING’s price outpaces its 50-day SMA of $31.22 and its 200-day SMA of $30.85.
The Nasdaq-100 surged to a fresh all-time high of 22,191.37 on Tuesday, as tech stocks continued their relentless climb. The Invesco QQQ Trust (NASDAQ:QQQ), the most popular ETF tracking the index, also notched a new 52-week high of $540, reflecting the broader tech momentum.
Meta’s Unstoppable Streak
Meta Platforms Inc (NASDAQ:META) has been on an absolute tear, closing higher for 20 consecutive trading sessions as of Friday. Although the stock was pulling back on Tuesday, down 3.8% at the time of publication.
Since Jan. 16, META stock has soared 16%, fueling the Nasdaq’s ascent. Given Meta’s decent weighting in the QQQ and other major ETFs, its rally has been a key force propelling both the tech-heavy Nasdaq and the broader market higher.
The AI boom continues to be a dominant theme, with Nvidia Corp (NASDAQ:NVDA), Microsoft Corp (NASDAQ:MSFT), and Alphabet Inc (NASDAQ:GOOGL) (NASDAQ:GOOG) leading the charge.
Strong corporate earnings have also played a pivotal role, as companies across the tech sector smash analyst expectations.
Meanwhile, economic indicators such as consumer spending and GDP growth are providing a sturdy foundation for investor confidence.
Investors are betting that the Federal Reserve has reached the peak of its rate hike cycle. Lower interest rates would provide further fuel for the Nasdaq-100’s upward momentum, making growth stocks even more attractive.
Inflation shows signs of easing, fueling optimism that a more dovish Fed could support higher equity valuations.
Technical Breakout With More Upside?
According to Adam Turnquist, Chief Technical Strategist at LPL Financial, the Nasdaq-100 has decisively broken out of its December highs and could have more room to run.
“A minimum technical-based price objective sets up near 23,650,” Turnquist notes.
Additionally, relative strength versus the S&P 500 is improving, pointing to continued Nasdaq leadership.
ETF Winners Riding The Surge
Tech-heavy ETFs are reaping the benefits of the rally. Invesco QQQM (NASDAQ:QQQM) and the First Trust Nasdaq BuyWrite Income ETF (NASDAQ:FTQI) have seen steady gains, while the broader SPDR S&P 500 ETF (NYSE:SPY) has also climbed, albeit at a slower pace.
With tech stocks leading the charge and Meta’s unrelenting rally keeping the momentum alive, the Nasdaq-100 looks poised for more record-breaking action.
Coca-Cola Co (NYSE:KO) will be reporting its fourth-quarter earnings on Tuesday. Wall Street expects 52 cents in EPS and $10.68 billion in revenues as the company reports before market hours.
The stock is up 7.45% over the past year, 3.74% year-to-date.
Let’s look at what the charts indicate for Coca-Cola stock and how the stock currently maps against Wall Street estimates.
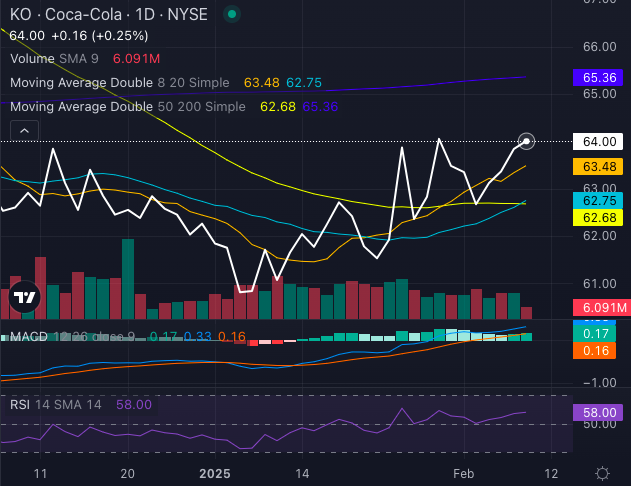
Coca-Cola stock is exhibiting a strongly bullish trend, with its share price trading above the eight-day, 20-day and 50-day simple moving averages. This sustained buying pressure indicates positive momentum, suggesting the potential for continued upside.
The stock’s strength is further reinforced by its Moving Average Convergence Divergence (MACD) indicator at 0.33, signaling bullish momentum.
Additionally, KO stock’s Relative Strength Index (RSI) stands at 58.00, placing it in neutral territory but trending toward overbought levels. This suggests that while the stock remains in an uptrend, investors should monitor for potential consolidation or a cooling-off period.
If buying pressure persists, Coca-Cola stock could continue its bullish trajectory, making it an attractive option for momentum-focused investors.
Coca-Cola Analysts See 11% Upside
Ratings & Consensus Estimates: The consensus analyst rating on Coca-Cola stock stands at a Buy currently with a price target of $71.30. The latest analyst ratings from RBC Capital, Jefferies and JPMorgan imply an 11.3% upside for KO stock, with an average price target of $71.33.
Stock Price Action: Coca-Cola stock was trading at $64 at the time of publication.
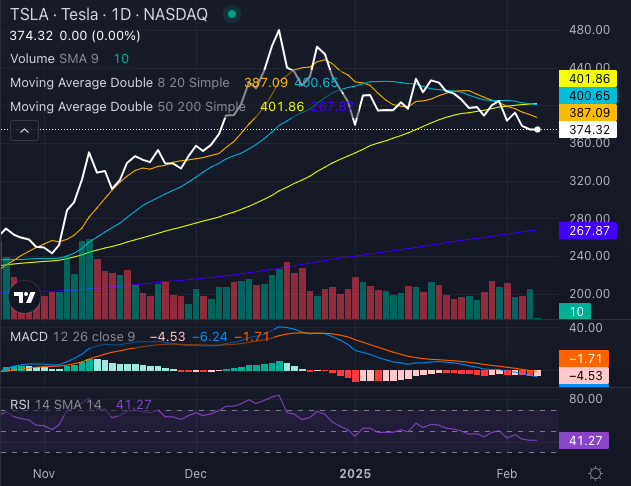
Trading at $374.32, TSLA stock remains below its eight, 20 and 50-day moving averages, flashing strong bearish signals. But if history has taught us anything, betting against CEO Elon Musk isn’t always wise.
Enter Optimus: Tesla’s Robot Revolution
While Tesla’s EV sales struggle, Musk is doubling down on AI and robotics. The company is aggressively hiring engineers and technicians at its Fremont factory to accelerate the rollout of its Optimus humanoid robot.
Musk envisions thousands of units hitting factory floors this year, with a long-term ambition of turning Optimus into a $10 trillion market disruptor.
Production costs? Targeted below $20K per unit once scaled.
Despite recent struggles, Tesla still has major catalysts in play:
FSD expansion into China and Europe
New Model Y production ramp-up
Cybercabs launching in Austin this summer
Price hikes on the Model X in the U.S. and Canada
But not all roads are smooth. Tesla’s China-made EV sales dropped 11.5% in January, with Model 3 and Model Y deliveries tumbling 32.6% from December. European sales are also slipping, as competition from BYD intensifies—the Chinese EV giant posted a staggering 47.5% YoY sales jump.
Is TSLA Stock Set For A Comeback?
The technical picture remains bearish, but Tesla’s 200-day moving average at $267.87 hints at a longer-term uptrend. With AI-driven robots, FSD expansion and new product launches in the pipeline, Tesla’s 2025 could be a rollercoaster.
Will TSLA stock rebound or is more turbulence ahead?
As both JPMorgan Chase & Co (NYSE:JPM) and Wells Fargo & Co (NYSE:WFC) prepare to release their fourth quarter earnings on Wednesday before the market opens, the spotlight’s on their technicals.
Investors are betting big on both, but only one can come out on top when the numbers drop. Let’s take a quick spin through the charts and see who’s in the driver’s seat ahead of the big reveal.
JPM Stock: Strong Bullish Momentum
JPM stock is cruising, and it’s not just the bull market that’s pushing it.
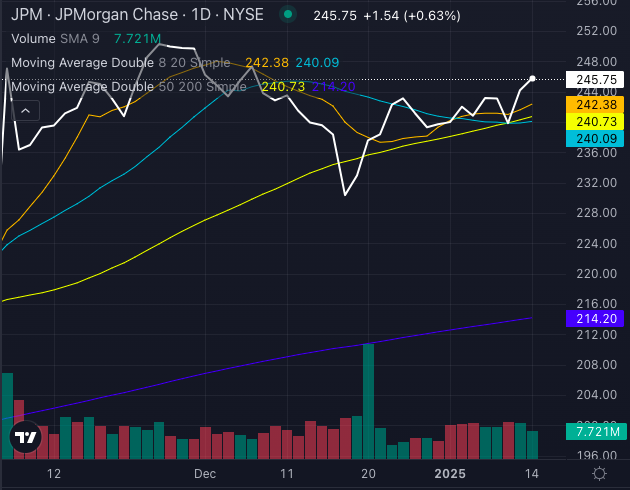
Trading at $245.75, JPM stock is firmly parked above its eight, 20, and 50-day simple moving averages (SMAs), signaling a roaring bullish trend. The stock has been soaking up buying pressure like a sponge, with investors clearly confident about its upcoming earnings report.
The eight-day SMA of $242.38, 20-day SMA of $240.09 and 50-day SMA of $240.73 are all flashing bullish signals – an indication that JPM stock is firing on all cylinders.
Looking ahead, analysts are forecasting strong results: $4.11 in EPS and $41.7 billion in revenue. Given the strong upward momentum and positive technicals, JPMorgan looks primed to continue its bull run post-earnings, barring any major surprises.
With its 200-day SMA sitting at $214.20, the long-term bullish trend is also clearly intact.
Trading at $71.17, WFC stock is still above its eight, 20 and 200-day moving averages, suggesting a bullish short and long-term outlook. But the medium-term charts aren’t quite as rosy. The 50-day SMA of $71.73 is giving off a bearish signal, indicating that WFC stock could be in for a bit of a pause, or even a minor pullback, before earnings.
The 50-day SMA trading above the price further confirms this potential weakness, even though the 200-day SMA of $61.67 continues to signal bullishness in the long run.
The Verdict: JPM Looks Stronger for Now
In the grand scheme of things, Wells Fargo’s longer-term trend is still bullish, but with technicals showing some indecision in the medium-term. So, WFC stock will need a solid earnings beat to kick things back into gear.
JPM stock, on the other hand, is looking incredibly strong across the board, and its solid bullish momentum makes it the clear technical winner going into Wednesday’s earnings report.
Is Trump Media & Technology Group Corp. (NASDAQ:DJT) stock climbing on optimism or concrete signals? The stock has surged 104% over the past year, with its rally appearing to align with President-elect Donald Trump‘s upcoming return to the White House.
But will the momentum last?
Technical Tea Leaves: Bullish, With A Dash Of Bear Risk
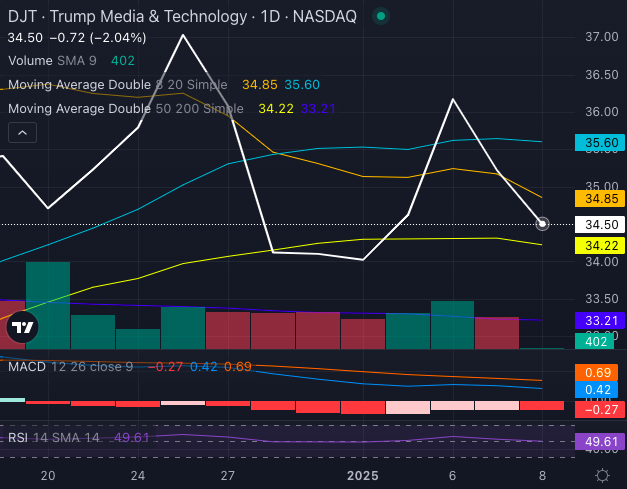
DJT stock, at $34.50, trades above its five, 20 and 50-day exponential moving averages, signaling a bullish outlook. Key indicators paint a mixed picture:
Eight-Day SMA (simple moving average) Bearish Signal: At $34.85, it’s just above the stock price, hinting at short-term bearishness.
20-Day SMA Bearish Signal: DJT is trading below the $35.60 level, sparking concerns about overextension.
50 and 200-Day SMA Bullish: At $34.22 and $33.21 respectively, these moving averages support the bullish case.
MACD at 0.42: Another bullish indicator, showing positive momentum.
RSI at 49.61: The stock isn’t overheated but inching toward neutral territory, reflecting a balance of buying and selling pressure.
Still, selling pressure could soon weigh on DJT, indicating a risk of bearish movement ahead.
Impact Of Courtroom Battles
Tuesday saw DJT stock dip slightly, following a New York court denying Trump’s immunity plea in his felony case. The judge’s ruling solidified Trump’s Jan. 10 sentencing date, just days before his presidential inauguration on Jan. 20.
The case stems from a $130,000 hush money payment in the 2016 election cycle, with Trump already convicted of 34 felony counts for falsifying business records.
Despite legal hurdles, Trump Media’s parent stock has remained resilient, buoyed by advertising revenue on its Truth Social platform and investor optimism about Trump’s 2025 inauguration.
Is DJT Stock’s Rally Worth Watching?
DJT’s performance might feel like a rally in lockstep with Trump’s political fortunes. While technical indicators lean bullish, the stock faces headwinds—court rulings, selling pressure, and recent dips hint at volatility ahead.
For investors, DJT presents a speculative opportunity worth monitoring closely, trading above key averages amid its inauguration rally, though ongoing legal and political developments add uncertainty to its trajectory.
Google-parent Alphabet Inc (NASDAQ:GOOGL) (NASDAQ:GOOG) has laid out its remedies proposal in the high-stakes search distribution case with the Department of Justice (DOJ).
JPMorgan analyst Doug Anmuth notes that Google’s focus on non-exclusivity and increased flexibility aligns with its strategy to limit regulatory overreach. However, investors should also turn their attention to Google’s operational strength, which could be a significant driver of long-term value.
Alphabet’s Remedies In DOJ Case
Google’s proposal, filed on Dec. 20, sidesteps the harsher measures suggested by the DOJ, such as divestiture of Chrome or Android. Instead, the company’s remedies focus on removing search exclusivity in browser and Android agreements and giving partners greater flexibility.
This should allow partners like Apple Inc. (NASDAQ:AAPL) and mobile carriers to preload multiple search engines. This shift could create opportunities for competitors, including Microsoft Corp (NASDAQ:MSFT), to vie for top spots.
Anmuth expects the judge’s final decision in August 2025 to strike a balance between the DOJ and Google’s proposals, likely considering user impacts. Still, the timing of remedy enforcement, appeals and potential injunctions adds uncertainty to financial implications.
‘Tremendous Innovation In AI’, ‘New Buyback’ Likely
While the legal battle unfolds, Alphabet’s fundamentals remain robust. Anmuth emphasizes that Alphabet is demonstrating “tremendous innovation in AI,” which continues to bolster healthy Search and overall ad revenue growth.
The company’s ability to “durably re-engineer the cost base and expand margins” further strengthens its financial position. Moreover, Alphabet “will likely announce a new buyback authorization at 1Q earnings,” signaling confidence in future cash flows, says Anmuth.
Alphabet Among JPMorgan’s 2025 Top Picks
JPMorgan sees Alphabet as “one of our 2025 Top Picks”, alongside Amazon.com Inc (NASDAQ:AMZN), Meta Platforms Inc (NASDAQ:META), and Spotify Technology SA (NYSE:SPOT). Anmuth projects a December 2025 price target of $232, supported by Alphabet’s strong 30%+ operating income margin and double-digit percentage revenue growth.
Beyond ads, Alphabet’s non-ad businesses like Cloud and YouTube subscriptions hold significant growth potential. Meanwhile, ventures like Waymo and Verily offer optionality for future value.
The Road Ahead For Alphabet Stock Investors
Investor focus is shifting toward how a new administration could influence final remedies due in March 2025. A potential settlement or adjustments in Apple’s search agreements could also sway outcomes.
The court case may cast a shadow though Alphabet’s core strengths are intact. Despite the regulatory noise, Alphabet stock remains a compelling play for investors seeking exposure to a leader in AI and digital transformation.
Microsoft’s push into advanced AI agents goes beyond traditional chatbots. The Interpreter for Teams offers real-time voice translations, even simulating the user’s voice, while the Employee Self-Service Agent simplifies HR and IT queries. With tools like Azure AI Foundry SDK, Microsoft empowers companies to build bespoke AI solutions, embedding automation across workflows.
This partnership with ServiceNow integrates Copilot AI agents to streamline front-office operations, signaling Microsoft’s ambition to dominate enterprise AI.
Nearly 70% of Fortune 500 companies now use Microsoft 365 Copilot, cementing its foothold in the corporate world.
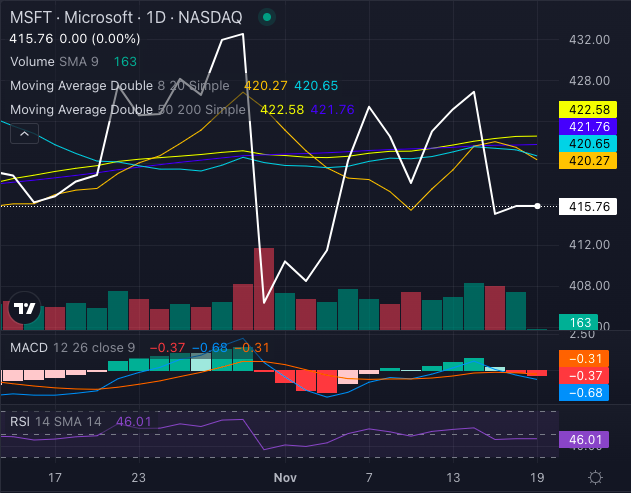
Microsoft stock, at $415.76, lies below its eight-day, 20-day, and 50-day simple moving averages, signaling downward pressure and bearish momentum over the short, medium and long term.
Momentum indicators like the Moving Average Convergence Divergence (MACD) at a negative 0.68 and the Relative Strength Index (RSI) at 46.01 further confirm the bearish sentiment.
However, slight buying pressure suggests cautious optimism among investors banking on Microsoft’s AI success.
Building The AI Ecosystem
Microsoft’s hardware announcements, including the Microsoft 365 Link, and its collaboration with Nvidia Corp (NASDAQ:NVDA) for Blackwell-powered GB200 servers, showcase its commitment to AI infrastructure.
With cutting-edge tools for cybersecurity like the Security Exposure Management platform and Data Loss Prevention for Microsoft 365 Copilot, Microsoft is addressing both innovation and risks in AI-driven enterprises.
The Verdict
While Microsoft faces technical headwinds, Microsoft’s long-term AI strategy remains robust. Its Copilot ecosystem, enterprise partnerships, and growing AI adoption position it as a key player in the tech industry.
The big question is whether Wall Street’s optimism in AI will outweigh the short-term bearish trends for Microsoft stock.
Investors may need to weigh the current technical challenges against the company’s AI-driven growth story before deciding their next move.