Netflix Inc (NASDAQ:NFLX) will report its second-quarter earnings on Thursday. Wall Street expects $4.42 in earnings per share (EPS) and $8.9 billion in revenues as the company reports after market hours.
The stock is up 42.88% over the past year, +32.09% year-to-date.
Let’s look at what the charts indicate for the company’s stock, and how it currently maps against Wall Street estimates.
Netflix Stock Chart Is Bearish, Faces Slight Selling Pressure
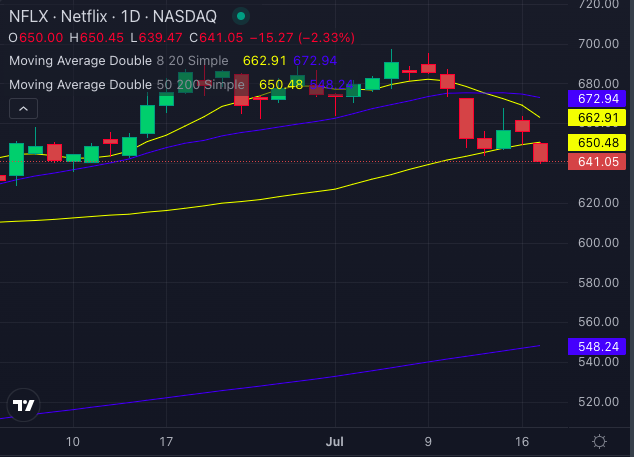
With the share price at $641.05, the 8-day SMA of $662.91, the 20-day SMA of $672.94 and the 50-day SMA at $650.48, all indicate bearish signals, reflecting short-to-medium term bearish sentiment.
However, the 200-day SMA at $548.24 signals bullishness, suggesting stronger long-term support.
The MACD indicator is positive at 0.53, reinforcing bullishness. However, the RSI is at 39.81 and treading lower, suggesting the stock may soon be in the oversold territory, potentially pointing to a rebound.
Additionally, the Bollinger Bands (25) with a range of $641.27 – $699.27 have the stock trading in the lower band, reflecting bearish sentiment.
Overall, technical indicators for Netflix stock are more bearish than bullish. There is a longer-term positive sentiment, as reflected in the 200-day SMA. However, near-term indicators support a further bearish downtrend for the stock.
StockRatings & Consensus Estimates: The consensus analyst rating on Netflix stock stands at a Buy currently with a price target of $672.33. Guggenheim, Macquarie, and Benchmark released analyst ratings for Netflix on July 16 and July 17, 2024. They set an average price target of $655, implying a 2.15% upside.
NFLXPrice Action: Netflix stock was trading at $641.20 at the time of publication.
Pinduoduo Inc. (NASDAQ:PDD) has demonstrated notable stock performance, reflecting strong market interest and investor confidence. The company is set to report Q1 earnings on Wednesday. Wall Street expects PDD to post $1.43 in EPS and $10.6 billion in revenue, as it reports before market hours.
At the time of publication on Monday, the stock was up 1.2% to $147.96. Over the past year, PDD stock has surged by 134%, and is up 1.6% in 2024. This performance underscores the stock’s resilience and potential for continued growth.
Several Bullish Indicators On PDD Stock Charts
From a technical analysis perspective, PDD is exhibiting several bullish indicators.
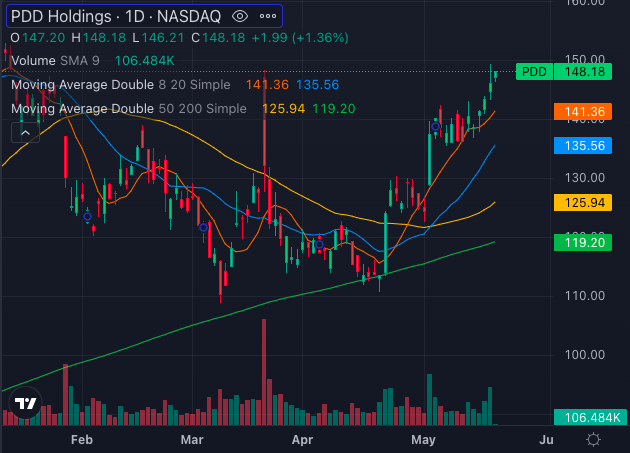
The stock is currently trading above its key moving averages, which signals sustained upward momentum. The share price of PDD is above the 8-day simple moving average (SMA) which indicates a bullish signal, reflecting short-term bullish sentiment.
The 20-day Simple Moving Average (SMA) suggests ongoing bullish momentum, with the stock price well above this short-term average. The 50-day SMA indicates a strong medium-term bullish trend, as the stock price remains higher than this average as well. Additionally, the 200-day SMA points to a prevailing long-term bullish sentiment, further reinforcing the overall positive outlook for the stock.
The Moving Average Convergence Divergence (MACD) indicator, standing at 5.89, suggests a strong bullish signal, indicating that the momentum is in favor of PDD stock.
However, the Relative Strength Index (RSI) at 71.89 suggests that the stock is currently overbought, which could signal potential short-term volatility or a pullback.
The Bollinger Bands analysis also supports a bullish outlook as well. The Bollinger Bands range between $121.31 and $149.82. With the current price well within these bands, and in fact trading in the upper (bullish) band, the stock is reflecting positive investor sentiment.
Analyst Bullish On Temu’s Potential, David Tepper Loading Up PDD Stock
Recent news has provided additional support for PDD’s bullish technical indicators.
UBS has raised its price target for Pinduoduo shares from $217 to $248, maintaining a Buy rating. This optimism is driven by the market potential of Temu, Pinduoduo’s overseas platform targeting low-income consumers. UBS believes that the market may be underestimating Temu’s geopolitical risks and its potential for significant market expansion, which could result in higher margins due to its managed e-commerce model.
Moreover, American billionaire hedge fund manager David Tepper has shown confidence in PDD, with Appaloosa Management purchasing 1.325 million shares in the first quarter of 2024, now holding 3.61% of the portfolio. This bullish stance from a prominent investor further boosts market confidence in PDD.
Pinduoduo stock exhibits strong bullish technical indicators supported by favorable market news and analyst upgrades. While the RSI suggests caution due to overbought conditions, the overall technical landscape and positive news flow position PDD as a compelling stock for investors.
PepsiCo Inc (NASDAQ:PEP) will be reporting its first-quarter earnings on April 23 before market hours.
Wall Street observers expect $1.52 in EPS and $18.12 billion in revenues.
Here’s a look at the stock:
PepsiCo stock is down 5.73% over the past year.
It’s up 2.53% year-to-date.
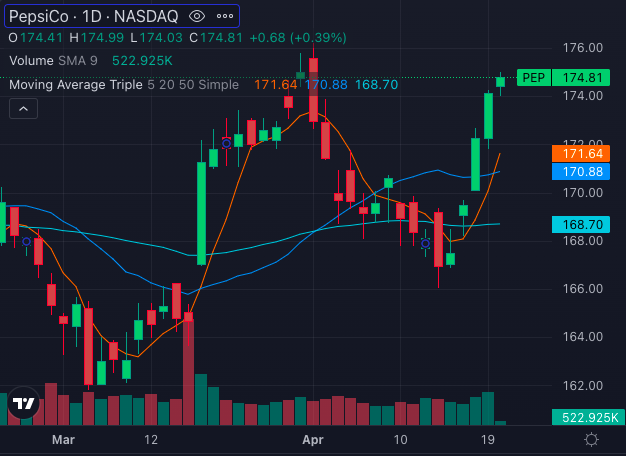
PepsiCo’s share price is currently above its 5, 20, and 50-day moving averages, indicating significant buying pressure and suggesting potential for further bullish movement.
With its price of $174.81, above the five-day simple moving average (SMA) of $171.64 and the 20-day SMA of $170.88, PepsiCo displays clear bullish signals.
Additionally, the stock’s price is above the 50-day simple moving average of $168.70 and the 200-day SMA of $171.69, reinforcing the bullish sentiment.
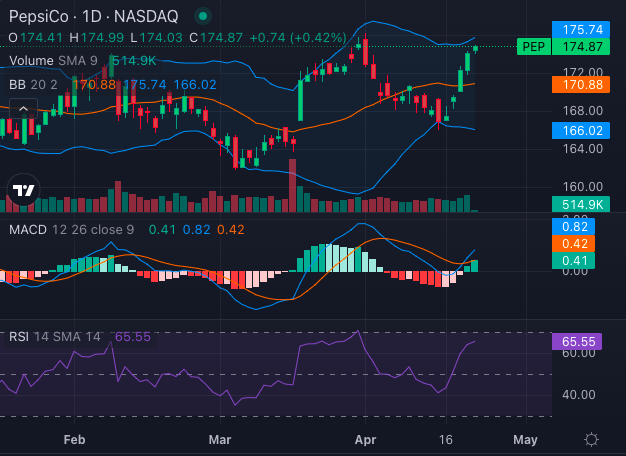
The Moving Average Convergence Divergence (MACD) indicator stands at 0.82 and has crossed over the signal, indicating a bullish momentum.
The Relative Strength Index (RSI) of 65.55 is steadily heading towards the overbought territory which begins at 70.
Bollinger Bands show the stock moving from the lower band to the upper band recently, reinforcing bullish sentiment for PepsiCo stock.
PepsiCo Analysts Consensus Ratings
Ratings & Consensus Estimates:The consensus analyst rating on PepsiCo stock stands at a Buy currently with a price target of $156.33.
The most recent analyst ratings issued from April 3 onwards by Barclays, Jefferies, and Argus Research, project an average price target of $131 for Pepsi stock. These ratings suggest a potential downside of approximately 24.73% for the company’s stock.
While the technicals appear bullish, analyst ratings appear to spell caution. Investors must take into account the fundamentals of the business too, when making an investment decision regarding PepsiCo stock.
Price Action: PepsiCo stock was trading at $174.56 at the time of publication.
Editor’s Note: This article has been updated to accurately report the remaining funds as $350 billion.
In an exclusive interview with Benzinga, Michael Sayers, CFA and vice president and portfolio manager at Rockland Trust, shared valuable insights into today’s investment opportunities.
Below, we explore the key questions and Sayers’ insightful responses:
How The CHIPS Act, IRA Act & Infrastructure Act Create Investment Opportunities
When asked about the anticipated influence of recent legislative developments like the CHIPS Act, IRA Act, and Infrastructure Act on investment opportunities, Sayers provided a comprehensive overview.
Regarding the potential effects of the CHIPS Act on technology investments and the semiconductor industry, Sayers pointed out the significant earmarked funds for semiconductors.
He highlighted the substantial infrastructure-related spending authorized by these acts, totaling approximately $1 trillion over the next decade.
A Significant Amount Of Money Still On The Table
Some quick back-of the napkin math by Sayers went as follows;
“Infrastructure-related spending across the Inflation Reduction Act (IRA), Infrastructure, and CHIPS acts totals ~$1 Trillion over a period of 10 years ending in 2031. About $650 billion has been authorized/committed so far.”
About $250 billion has been allocation to semiconductors.
This should benefit investments into the iShares Semiconductor ETF (NYSE:SOXX) which provides exposure to the semiconductor equity sector in the U.S.
Another $250 billion to clean energy and power.
The iShares Global Clean Energy ETF (NYSE:ICLN), along with the Invesco Solar ETF (NYSE:TAN) are among the two most popular ETFs that should benefit from this allocation.
$150 billion has been allocated for EV and EV batteries.
Investors in the Global X Autonomous & Electric Vehicles ETF (NASDAQ:DRIV), the iShares Self-Driving EV and Tech ETF (NYSE:IDRV) and the KraneShares Electric Vehicles and Future Mobility Index ETF (NYSE:KARS) which invest in stocks of electric vehicle manufacturers, should see this benefit trickling down to them.
“That leaves a significant amount of money still on the table, particularly under the IRA & CHIPS acts,” Sayer said pointing to $350 billion remaining from the total $1 trillion allocation.
Multi-Year Runway Of Annualized Double-Digit Growth Ahead
Backed by the $350 billion remaining, Sayers emphasized, “There is a multi-year runway of annualized double-digit growth in infrastructure-related construction & manufacturing spending ahead of us through the end of the decade.”
Rockland Trust allocates to the Russell Global Infrastructure Fund (RGISX) to take advantage of this positive outlook but also to provide diversification to the high-quality stock & bond portfolios that the firm manages for its clients
Investment Opportunities: Building upon Sayer’s insights into the potential growth in infrastructure and manufacturing sectors, let’s explore capital market instruments that investors could utilize to partake in this anticipated growth. Various Exchange-Traded Funds (ETFs) present attractive options for investors seeking exposure to these sectors.
ETFs for Infrastructure and Manufacturing Sectors: Infrastructure ETFs such as PAVE, IGF, and IFRA, as well as Manufacturing/Industrials ETFs like XLI and ITA, offer exposure to sectors poised for growth amid these legislative developments.
Let’s first look at the top infrastructure ETFs
These ETFs provide investors with diversified portfolios of companies operating in infrastructure development, manufacturing, and related industries, aligning with the anticipated growth trajectories highlighted by Sayers.
Some popular Infrastructure ETFs include:
Symbol
ETF
Total Assets ($MM)
YTD% (as of April 15)
PAVE
Global X US Infrastructure Development ETF
$7,514.84
+11.32%
IGF
iShares Global Infrastructure ETF
$3,503.42
-1.49%
IFRA
iShares U.S. Infrastructure ETF
$2,320.23
4.71%
NFRA
FlexShares STOXX Global Broad Infrastructure Index Fund
$2,215.70
-2.04%
Now let’s look at the top Manufacturing/Industrial ETFs
Symbol
ETF
Total Assets ($MM)
YTD% (as of April 15)
XLI
XLI Industrial Select Sector SPDR Fund
$18,253,700
8.15%
ITA
ITA iShares U.S. Aerospace & Defense ETF
$5,998,910
1.09%
VIS
VIS Vanguard Industrials ETF
$5,328,240
7.99%
PPA
PPA Invesco Aerospace & Defense ETF
$3,012,080
7.63%
FXR
FXR First Trust Industrials/Producer Durables AlphaDEX Fund
$1,942,100
8.12%
Investors can strategically navigate legislative developments and capitalize on emerging growth sectors by leveraging ETFs tailored to infrastructure and manufacturing industries.
With the guidance of financial professionals and thorough research, investors can position themselves to benefit from the evolving economic landscape.
As the tech sector braces for its upcoming earnings season, Wedbush Securities analyst Daniel Ives provides a bullish outlook.
Tech Sell-Off – A Compelling Buying Opportunity
He foresees a potential 15% surge in key stocks including Microsoft Corp (NASDAQ:MSFT), Alphabet Inc (NASDAQ:GOOGL) (NASDAQ:GOOG), Amazon.com Inc (NASDAQ:AMZN), Palantir Technologies Inc (NYSE:PLTR), and Meta Platforms Inc (NASDAQ:META).
Ives views the recent risk-off environment and tech sell-off as a compelling buying opportunity, attributing the market downturn to concerns such as a hot Consumer Price Index (CPI), weak bank earnings, and geopolitical tensions.
Over the past month, the SPDR Technology Select Sector ETF (NYSE:XLK) is down 2.63%. The broad market S&P 500 tracking SPDR S&P 500 ETF (NYSE:SPY) is down 1.16% over the same period.
However, he believes the spotlight will soon shift to the eagerly anticipated tech earnings season, which he expects to be robust across the board.
Q1 Earnings To Set The Stage For Upward Momentum In Tech Stocks
According to Ives, the anticipated strength in tech stocks isn’t solely based on multiples but stems from accelerating growth and earnings, surpassing Street expectations. He emphasizes the pivotal role of the upcoming Q1 earnings season in setting the stage for further upward momentum in the tech sector throughout the year.
Here’s a glimpse of when these promising tech companies are scheduled to report earnings:
Expectations are high for standout performances from tech giants such as Microsoft, Alphabet, Amazon, Palantir, and Meta. Sectors like software, cybersecurity, digital advertising, and semiconductors, should get particular attention, per Ives.
Other Potential Standouts
Ives also highlights cybersecurity firms like Zscaler Inc (NASDAQ:ZS), CrowdStrikeHoldings Inc (NASDAQ:CRWD), Palo Alto Networks Inc (NASDAQ:PANW), CyberArk Software Ltd (NASDAQ:CYBR), CheckPoint Software Technologies Ltd (NASDAQ:CHKP), and Tenable Holdings Inc (NASDAQ:TENB) as potential standouts in the upcoming earnings reports.
Confidence in the potential of the AI Revolution to drive growth is bolstered by field checks conducted globally over the past month, indicating that monetization in this realm has entered a new phase of accelerated growth.
As investors await the earnings reports, the tech sector remains poised for further appreciation, with Ives projecting a 15% increase in tech stocks for the year.
With software, cybersecurity, digital advertising, and semiconductors taking center stage, the upcoming earnings season could mark a significant milestone in reaffirming the tech sector’s growth trajectory for the remainder of 2024.
Delta Air Lines, Inc. (NYSE:DAL) stock was trading higher on Wednesday morning before dipping with the broader market. The company reported better-than-expected Q1 earnings, delivering a 25% surprise on earnings and a 9.39% surprise on revenue.
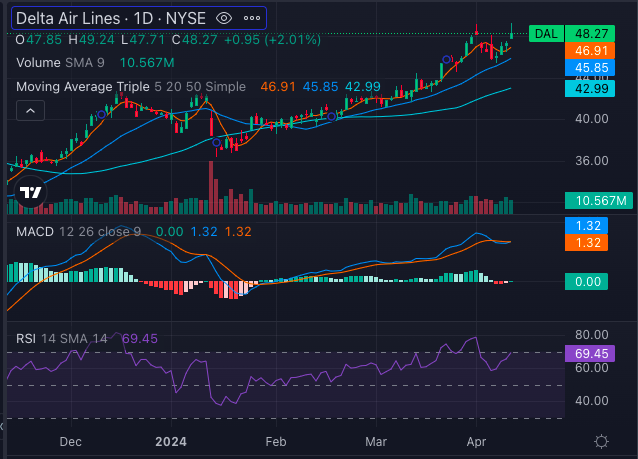
Delta stock was trading at $30 a share at the end of October 2023. It’s now around $48 a share – that’s a gain of over 50% in less than 6 months. So far this year, the stock is up 17%.
While the stock has provided substantial returns over the past six months, investors of Delta Air Lines stock are always keen to know whether there’s room to run further.
Let’s look at how the stock is positioned on the technical charts, and what analysts have to say.
Delta Air Lines stock is trading well above its 5-day, 20-day and 50-day simple moving averages (SMAs). This implies a strong bullish trend in the short to medium-term. This suggests that the stock price has been consistently increasing over the recent days and weeks, indicating positive momentum and investor confidence.
The Moving Average Convergence/Divergence (MACD) is also at a bullish 1.32 level. However, the Relative Strength Index (RSI) is at 69, nearing the overbought territory – spelling caution for investors.
Analysts Continue To See Upside
The most recent analyst ratings on Delta Air Lines stock were issued in April by Susquehanna, BofA Securities, and Morgan Stanley. Based on the collective average price target of $64 from these three analysts, Delta Air Lines is anticipated to experience a potential upside of 32.64%.
Delta Air Lines stock is the top holding of the U.S. Global Jets ETF (NYSE:JETS). The stock commands 11.86% of the JETS portfolio. JETS is up about 8% YTD, primarily driven by Delta’s stock performance.
Other major holdings of the ETF include United Airlines Holdings (NYSE:UAL) – 10.46%, American Airlines Group Inc (NYSE:AAL) – 10.00% and Southwest Airlines Co (NYSE:LUV) – 8.80% of the JETS portfolio.
DAL Price Check: Shares of Delta were down 0.2% at $47.22 at last check Wednesday.
Despite facing intensified competition in the weight-loss drug market, particularly with the emergence of its own product Zepbound, Eli Lilly & Co‘s (NYSE:LLY) strategic positioning and technical resilience present a compelling investment opportunity.
Zepbound boasts impressive weight-loss efficacy in clinical trials. It also marks a significant milestone for Eli Lilly in the weight-loss drug market.
However, it’s imperative to note that competition remains stiff, with established players like Novo Nordisk A/S (NYSE:NVO), the maker of Ozempic, vying for market share.
Eli Lilly’s stock has performed well over the past year, gaining 116.84%. So far in 2024, the stock has returned 29.45% to investors.
Looking ahead, the current technical trend shows a moderate bearish sentiment with slight selling pressure observed. Despite this, there are signals indicating potential opportunities:
Moving Averages: The 50-day and 200-day simple moving averages (SMAs) present a bullish signal, suggesting potential reversal in the near term. However, the shorter-term moving averages (8-day and 20-day) exhibit a sell signal, indicating a short-term bearish sentiment.
Exponential Moving Averages (EMA): Similar to SMAs, EMAs reflect mixed signals, with shorter-term averages signaling bearish sentiments and longer-term averages indicating bullishness.
MACD & RSI: The MACD indicator suggests a bullish market sentiment, underscoring potential bullish momentum. However, the RSI indicates that the stock is overbought, warranting cautious optimism.
Bollinger Bands: Both short-term and long-term Bollinger Bands present a buy signal, suggesting a favorable risk-reward profile for investors.
Eli Lilly’s resilience in the face of competition, alongside its innovative pipeline, presents an enticing investment opportunity. Despite short-term fluctuations, its solid fundamentals and strategic positioning make it a compelling choice for investors seeking long-term growth.
Analyst Reaction: The most recent analyst ratings for Eli Lilly stock, released by Cantor Fitzgerald, Truist Securities, and JP Morgan on April 1, March 22 and March 15, respectively, contribute to an average price target of $838.33. This indicates a potential upside of 10.55% for Eli Lilly and Co based on the assessments of these three analysts.
LLY Price Action: Eli Lilly stock was trading at $758 a share at the time of publication.
Boeing Co (NYSE:BA) faces a challenging year, with its stock plummeting 25% year-to-date. The recent emergency landing of a Delta Air Lines flight at Minneapolis-St. Paul International Airport (MSP) further compounds the company’s turbulent trajectory.
The Delta flight, en route from Denver to Minneapolis, descended to a lower altitude out of caution to evaluate a potential maintenance issue, reported CBS News.
Fortunately, the Boeing 737 landed safely at MSP, 13 minutes ahead of schedule, according to FlightAware.com.
Emergency Landing Adds Turbulence
This incident is just one in a series that has plagued Boeing and its stock, in recent months. From an Alaska Airlines flight’s emergency landing in January to a low-speed collision involving two Delta planes, Boeing’s safety record has come under intense scrutiny.
Amidst these challenges, investors are left wondering: Is Boeing stock a buy?
Is Boeing Stock A Buy?
Despite the stock’s significant decline, analysts remain divided on its prospects. Boeing stock has a consensus price target of $216.04, established from looking at the 100 latest analyst ratings.
However, the last three analyst ratings were released from Citigroup, Benchmark, and Morgan Stanley in March, have an average price target of $245.67 on the stock. That’s an implied 28.10% upside for Boeing stock from these 3 analyst ratings.
Investors must, however, bear in mind that while analysts foresee a potential upside, others caution against the risks posed by ongoing safety issues and regulatory scrutiny.
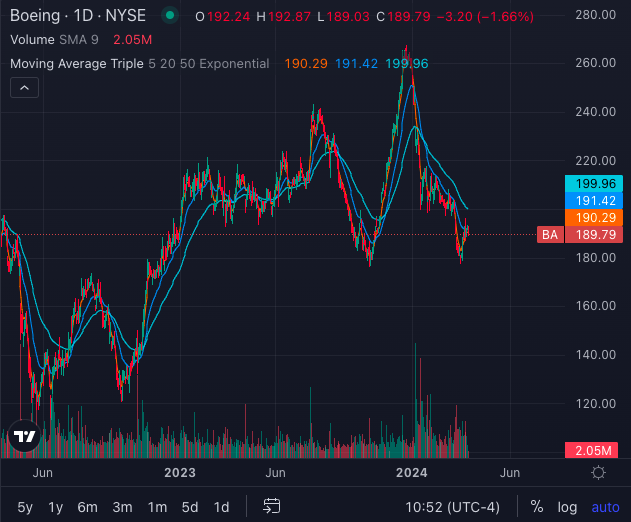
On the technical side, Boeing stock trading below its 5, 20, and 50-day exponential moving averages indicates a strong bearish sentiment. The stock also made a Death Cross on March 8. However, buying pressure accompanies this trend, signaling a potential bullish movement in the future.
As Boeing navigates through this turbulent period, investors must weigh the potential rewards against the inherent risks before making any investment decisions.
In an era dominated by accelerated compute workloads, such as artificial intelligence (AI), the demand for robust networking and optical infrastructure has never been higher.
The OFC Networking conference in San Diego this week unveiled insights into the trajectory of this demand, setting the stage for significant growth in CY24 and CY25.
According to Harlan Sur, an analyst at JPMorgan, the landscape for semiconductor companies catering to networking and optical sectors presents promising opportunities.
“Bottom line, the AI-driven networking/optical demand outlook remains strong through next year,” Sur wrote in a research note.
Sur’s investment thesis highlights the pivotal role of three key players: Broadcom Inc (NASDAQ:AVGO), Marvell Technology Inc (NASDAQ:MRVL), and MACOM Technology Solutions Holdings Inc (NASDAQ:MTSI).
Broadcom: Sur notes that Broadcom stands to benefit substantially from the expansion of high-performance networking required to support AI and accelerated compute workloads. With their AI networking revenues projected to increase significantly this year, Broadcom’s innovations in co-packaged optics (CPO) and next-gen switching chipsets position them at the forefront of the industry.
Marvell: Sur emphasizes Marvell’s dominance in PAM4 DSP chipsets, critical for enabling higher optical connectivity in data centers. Marvell’s collaborations with tech giants like Alphabet Inc (NASDAQ:GOOGL) (NASDAQ:GOOG) aka Google, Amazon.com Inc (NASDAQ:AMZN), Meta Platforms Inc (NASDAQ:META), and Microsoft Corp (NASDAQ:MSFT), underscore their pivotal role in driving the transition to advanced networking architectures. The impending 1.6T upgrade cycle further solidifies Marvell’s position as a key player in the semiconductor market.
MACOM: Sur highlights MACOM’s comprehensive portfolio of high-performance analog and photonic components, essential for supporting next-generation networking architectures. MACOM’s focus on innovation, particularly in linear drive pluggable optics (LPO) and copper transceiver architectures, positions them as a reliable partner for customers navigating the evolving connectivity landscape.
The outlook for AI-driven networking and optical demand remains robust, with Broadcom, Marvell, and MACOM poised to capitalize on the opportunities presented by this burgeoning market.
Dollar General Corp (NYSE:DG) will be reporting its fourth-quarter earnings on March 14. Wall Street expects $1.75 in EPS and $9.78 billion in revenues as the company reports before market hours.
After plummeting for the first three quarters in 2023, Dollar General stock recovered and is up 55% since Oct. 2, 2023. In 2024 so far, the stock had returned about 19% to investors. The stock is now on the heels of triggering a Golden Cross.
As the Goodlettsville, Tennessee-based company prepares to report Q4 earnings, let’s take a look at what the technical setup looks like, and how the stock currently maps against Wall Street estimates.
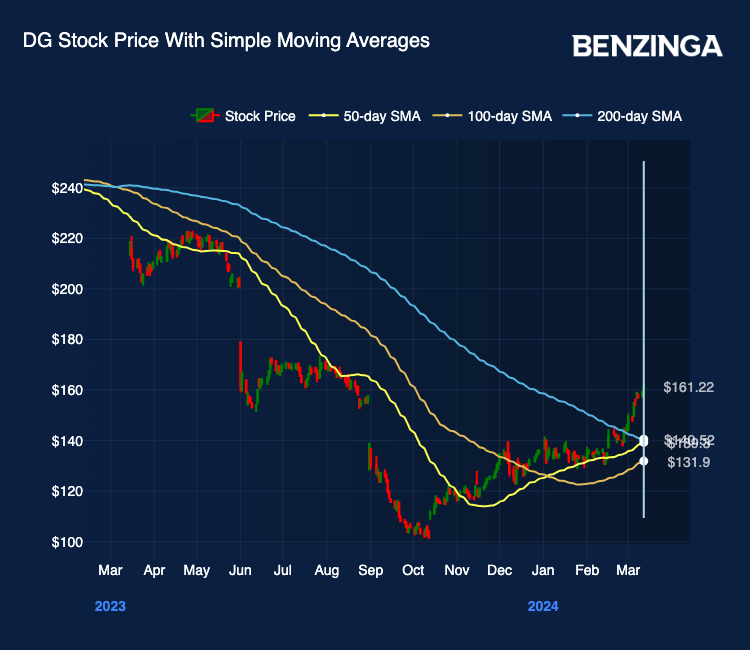
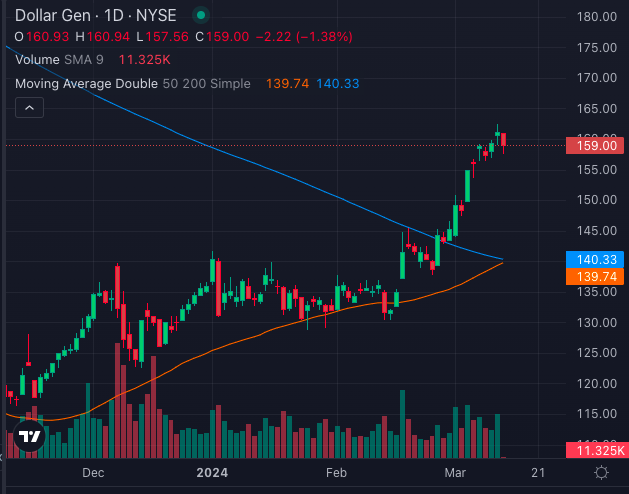
Dollar General stock is just about to trigger a Golden Cross ahead of Q4 earnings due on March 14.
As can be seen on the chart above, its 50-day simple moving average (SMA) (yellow line) is just about to cross above the 200-day SMA (blue line), validating the bullish trend reversal the stock has witnessed over the past six months.
A Golden Cross forming just ahead of the company’s eagerly anticipated Q4 earnings, is likely to pique the interest of investors. The technical signal typically indicates a shift in market sentiment towards optimism regarding the stock’s future performance.
With the impending earnings release poised to provide further insights into Dollar General’s financial health and prospects, the timing of a Golden Cross could amplify investor anticipation and influence trading activity surrounding the stock.
Dollar General Analysts Consensus Ratings
Ratings & Consensus Estimates:The consensus analyst rating on the company’s stock stands at a Neutral currently with a price target of $134.07. Reviews received by the stock in March have a price target of $155-$158 on the stock.
DG Price Action: Dollar General stock was at $161.22 at the close of trading day on March 12.