Analysts expect the Bolingbrook, Illinois-based company to report quarterly earnings at $7.15 per share, down from $8.08 per share in the year-ago period. Ulta Beauty projects quarterly revenue of $3.47 billion, compared to $3.55 billion a year earlier, according to data from Benzinga Pro.
On Jan. 6, Ulta announced that Dave Kimbell will retire as CEO and step down from the company’s board, effective immediately.
Ulta Beauty shares fell 3.9% to close at $329.23 on Wednesday.
Benzinga readers can access the latest analyst ratings on the Analyst Stock Ratings page. Readers can sort by stock ticker, company name, analyst firm, rating change or other variables.
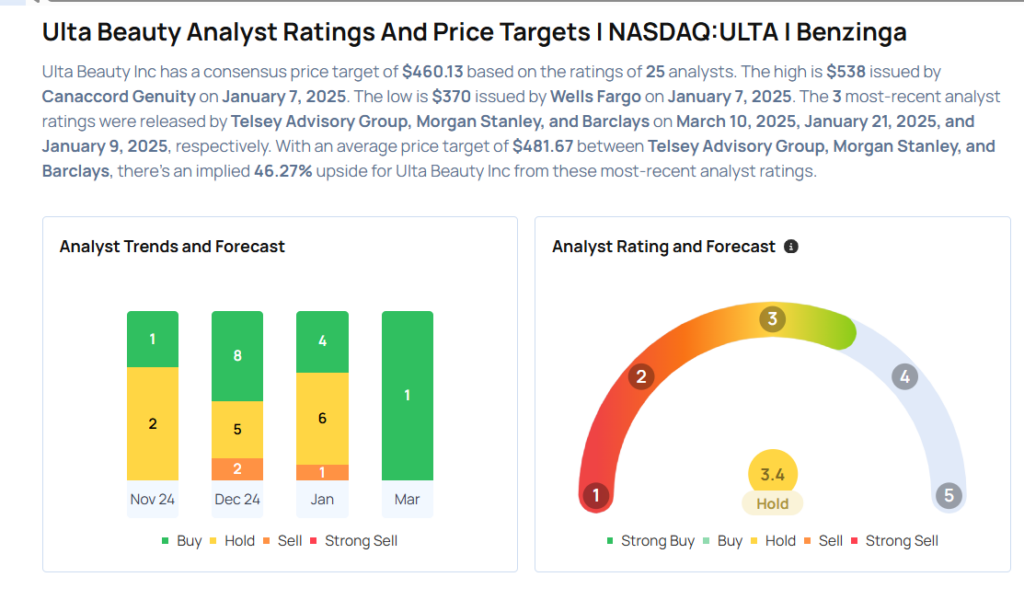
Morgan Stanley analyst Simeon Gutman upgraded the stock from Equal-Weight to Overweight and raised the price target from $430 to $500 on Jan. 21, 2025. This analyst has an accuracy rate of 66%.
Barclays analyst Adrienne Yih maintained an Equal-Weight rating and boosted the price target from $410 to $445 on Jan. 9, 2025. This analyst has an accuracy rate of 62%.
Citigroup analyst Kelly Crago maintained a Neutral rating and boosted the price target from $450 to $457 on Jan. 7, 2025. This analyst has an accuracy rate of 72%.
B of A Securities analyst Lorraine Hutchinson maintained a Neutral rating and raised the price target from $460 to $475 on Jan. 7, 2025. This analyst has an accuracy rate of 65%.
Stifel analyst Mark Astrachan maintained a Hold rating and increased the price target from $455 to $475 on Jan. 7, 2025. This analyst has an accuracy rate of 75%.
Considering buying ULTA stock? Here’s what analysts think:
Analysts expect the Pittsburgh, Pennsylvania-based company to report quarterly earnings at 51 cents per share, down from 61 cents per share in the year-ago period. American Eagle projects quarterly revenue of $1.6 billion, compared to $1.68 billion a year earlier, according to data from Benzinga Pro.
On Jan. 13, American Eagle Outfitters raised its fourth-quarter operating profit outlook.
With the recent buzz around American Eagle, some investors may be eyeing potential gains from the company’s dividends too. As of now, American Eagle offers an annual dividend yield of 4.35%, which is a quarterly dividend amount of 13 cents per share ($0.50 a year).
To figure out how to earn $500 monthly from American Eagle, we start with the yearly target of $6,000 ($500 x 12 months).
Next, we take this amount and divide it by American Eagle’s $0.50 dividend: $6,000 / $0.50 = 12,000 shares.
So, an investor would need to own approximately $137,880 worth of American Eagle, or 12,000 shares to generate a monthly dividend income of $500.
Assuming a more conservative goal of $100 monthly ($1,200 annually), we do the same calculation: $1,200 / $0.50 = 2,400 shares, or $27,576 to generate a monthly dividend income of $100.
Note that dividend yield can change on a rolling basis, as the dividend payment and the stock price both fluctuate over time.
The dividend yield is calculated by dividing the annual dividend payment by the current stock price. As the stock price changes, the dividend yield will also change.
For example, if a stock pays an annual dividend of $2 and its current price is $50, its dividend yield would be 4%. However, if the stock price increases to $60, the dividend yield would decrease to 3.33% ($2/$60).
Conversely, if the stock price decreases to $40, the dividend yield would increase to 5% ($2/$40).
Further, the dividend payment itself can also change over time, which can also impact the dividend yield. If a company increases its dividend payment, the dividend yield will increase even if the stock price remains the same. Similarly, if a company decreases its dividend payment, the dividend yield will decrease.
AEO Price Action: Shares of American Eagle fell by 5% to close at $11.49 on Tuesday.
Analysts expect the Menlo Park, California-based company to report quarterly earnings at $6.77 per share, up from $5.33 per share in the year-ago period. Meta projects quarterly revenue of $46.99 billion, compared to $40.11 billion a year earlier, according to data from Benzinga Pro.
The company has beaten analyst estimates for revenue in nine straight quarters.
With the recent buzz around Meta, some investors may be eyeing potential gains from the company’s dividends too. As of now, Meta offers an annual dividend yield of 0.30%, which is a quarterly dividend amount of 50 cents per share ($2.00 a year).
To figure out how to earn $500 monthly from Meta, we start with the yearly target of $6,000 ($500 x 12 months).
Next, we take this amount and divide it by Meta’s $2.00 dividend: $6,000 / $2.00 = 3,000 shares.
So, an investor would need to own approximately $2,022,990 worth of Meta, or 3,000 shares to generate a monthly dividend income of $500.
Assuming a more conservative goal of $100 monthly ($1,200 annually), we do the same calculation: $1,200 / $2.00 = 600 shares, or $404,598 to generate a monthly dividend income of $100.
Note that dividend yield can change on a rolling basis, as the dividend payment and the stock price both fluctuate over time.
The dividend yield is calculated by dividing the annual dividend payment by the current stock price. As the stock price changes, the dividend yield will also change.
For example, if a stock pays an annual dividend of $2 and its current price is $50, its dividend yield would be 4%. However, if the stock price increases to $60, the dividend yield would decrease to 3.33% ($2/$60).
Conversely, if the stock price decreases to $40, the dividend yield would increase to 5% ($2/$40).
Further, the dividend payment itself can also change over time, which can also impact the dividend yield. If a company increases its dividend payment, the dividend yield will increase even if the stock price remains the same. Similarly, if a company decreases its dividend payment, the dividend yield will decrease.
META Price Action: Shares of Meta gained by 2.2% to close at $674.33 on Tuesday.
Analysts expect the Jacksonville, Florida-based company to report quarterly earnings at 42 cents per share, down from 45 cents per share in the year-ago period. CSX projects quarterly revenue of $3.56 billion, compared to $3.68 billion a year earlier, according to data from Benzinga Pro.
On Jan. 16, Wells Fargo analyst Aaron Rakers maintained Seagate with an Equal-Weight rating and lowered the price target from $120 to $110.
With the recent buzz around CSX, some investors may be eyeing potential gains from the company’s dividends too. As of now, CSX offers an annual dividend yield of 1.44%, which is a quarterly dividend amount of 12 cents per share (48 cents a year).
So, how can investors exploit its dividend yield to pocket a regular $500 monthly?
To earn $500 per month or $6,000 annually from dividends alone, you would need an investment of approximately $415,500 or around 12,500 shares. For a more modest $100 per month or $1,200 per year, you would need $83,100 or around 2,500 shares.
To calculate: Divide the desired annual income ($6,000 or $1,200) by the dividend ($0.48 in this case). So, $6,000 / $0.48 = 12,500 ($500 per month), and $1,200 / $0.48 = 2,500 shares ($100 per month).
Note that dividend yield can change on a rolling basis, as the dividend payment and the stock price both fluctuate over time.
How that works: The dividend yield is computed by dividing the annual dividend payment by the stock’s current price.
For example, if a stock pays an annual dividend of $2 and is currently priced at $50, the dividend yield would be 4% ($2/$50). However, if the stock price increases to $60, the dividend yield drops to 3.33% ($2/$60). Conversely, if the stock price falls to $40, the dividend yield rises to 5% ($2/$40).
Similarly, changes in the dividend payment can impact the yield. If a company increases its dividend, the yield will also increase, provided the stock price stays the same. Conversely, if the dividend payment decreases, so will the yield.
CSX Price Action: Shares of CSX fell 0.1% to close at $33.24 on Wednesday.
Netflix Inc. (NASDAQ:NFLX) reported stronger-than-expected fourth-quarter financial results on Tuesday.
Netflix reported fourth-quarter revenue of $10.25 billion, up 16% year-over-year. The revenue total beat a Street consensus estimate of $10.11 billion according to data from Benzinga Pro.
The company reported earnings per share of $4.27 for the quarter, beating a Street consensus estimate of $4.19.
Netflix reported it added 18.91 million paid subscribers in the fiscal quarter, up 15.9% year-over-year.
Netflix is guiding for first-quarter revenue to be $10.42 billion, which would be up 11.2% year-over-year. The company is guiding for operating income of $2.94 billion in the first quarter and earnings per share of $5.58.
Full-year guidance for revenue in 2025 is now listed as a range of $43.5 billion to $44.5 billion, up $0.5 billion from the company’s previous range. This guidance represents year-over-year revenue growth of 12% to 14%.
Netflix shares gained 1.4% to close at $869.68 on Tuesday.
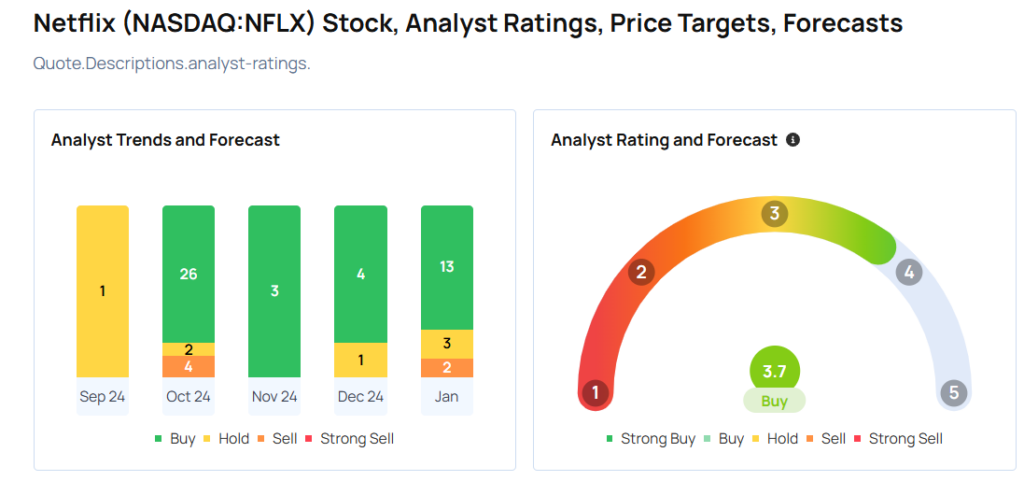
These analysts made changes to their price targets on Netflix following earnings announcement.
Canaccord Genuity analyst Maria Ripps upgraded Netflix from Hold to Buy and raised the price target from $940 to $1,150.
Barclays analyst Kannan Venkateshwar upgraded the stock from Underweight to Equal-Weight and raised the price target from $715 to $900.
Needham analyst Laura Martin maintained the stock with a Buy and raised the price target from $800 to $1,150.
Deutsche Bank analyst Bryan Kraft maintained the stock with a Hold and raised the price target from $650 to $875.
Pivotal Research analyst Jeffrey Wlodarczak maintained Netflix with a Buy and boosted the price target from $1,100 to $1,250.
B of A Securities analyst Jessica Reif Ehrlich maintained the stock with a Buy and raised the price target from $1,000 to $1,175.
Morgan Stanley analyst Benjamin Swinburne maintained Netflix with an Overweight and raised the price target from $1,050 to $1,150.
JP Morgan analyst Doug Anmuth maintained Netflix with an Overweight and raised the price target from $1,000 to $1,150.
Considering buying NFLX stock? Here’s what analysts think:
Analysts expect the Winona, Minnesota-based company to report quarterly earnings at 48 cents per share, up from 46 cents per share in the year-ago period. Fastenal projects quarterly revenue of $1.84 billion, compared to $1.76 billion a year earlier, according to data from Benzinga Pro.
On Dec. 11, Stifel analyst Brian Butler downgraded Fastenal from Buy to Hold and maintained the price target of $86.
With the recent buzz around Fastenal, some investors may be eyeing potential gains from the company’s dividends too. Fastenal offers an annual dividend yield of 2.18%, which is a quarterly dividend amount of 39 cents per share ($1.56 a year).
So, how can investors exploit its dividend yield to pocket a regular $500 monthly?
To earn $500 per month or $6,000 annually from dividends alone, you would need an investment of approximately $275,489 or around 3,846 shares. For a more modest $100 per month or $1,200 per year, you would need $55,083 or around 769 shares.
To calculate: Divide the desired annual income ($6,000 or $1,200) by the dividend ($1.56 in this case). So, $6,000 / $1.56 = 3,846 ($500 per month), and $1,200 / $1.56 = 769 shares ($100 per month).
Note that dividend yield can change on a rolling basis, as the dividend payment and the stock price both fluctuate over time.
How that works: The dividend yield is computed by dividing the annual dividend payment by the stock’s current price.
For example, if a stock pays an annual dividend of $2 and is currently priced at $50, the dividend yield would be 4% ($2/$50). However, if the stock price increases to $60, the dividend yield drops to 3.33% ($2/$60). Conversely, if the stock price falls to $40, the dividend yield rises to 5% ($2/$40).
Similarly, changes in the dividend payment can impact the yield. If a company increases its dividend, the yield will also increase, provided the stock price stays the same. Conversely, if the dividend payment decreases, so will the yield.
Price Action: Shares of Fastenal fell 1.8% to close at $71.63 on Friday.
The most oversold stocks in the materials sector presents an opportunity to buy into undervalued companies.
The RSI is a momentum indicator, which compares a stock’s strength on days when prices go up to its strength on days when prices go down. When compared to a stock’s price action, it can give traders a better sense of how a stock may perform in the short term. An asset is typically considered oversold when the RSI is below 30, according to Benzinga Pro.
Here’s the latest list of major oversold players in this sector, having an RSI near or below 30.
On Dec. 9, MP Materials announced exchanges of a portion of its 0.25% green convertible senior notes due 2026, representing a net reduction of $25 million of outstanding indebtedness. The company’ stock fell around 1% over the past month and has a 52-week low of $10.02.
RSI Value: 29.9
MP Price Action: Shares of MP closed at $19.38 on Wednesday.
Benzinga Pro’s real-time newsfeed alerted to latest MP news.
On Jan. 7, Raymond James analyst Matt Roberts initiated coverage on AptarGroup with an Outperform rating and announced a price target of $200. The company’s stock fell around 10% over the past month and has a 52-week low of $124.94.
RSI Value: 28.6
ATR Price Action: Shares of Aptargroup closed at $154.15 on Wednesday.
Benzinga Pro’s charting tool helped identify the trend in ATR stock.
On Jan. 7, Piper Sandler analyst Charles Neivert maintained Westlake with an Overweight and lowered the price target from $155 to $135.. The company’s stock fell around 10% over the past month and has a 52-week low of $108.95.
RSI Value: 19.8
WLK Price Action: Shares of Westlake fell 0.1% to close at $110.54 on Wednesday.
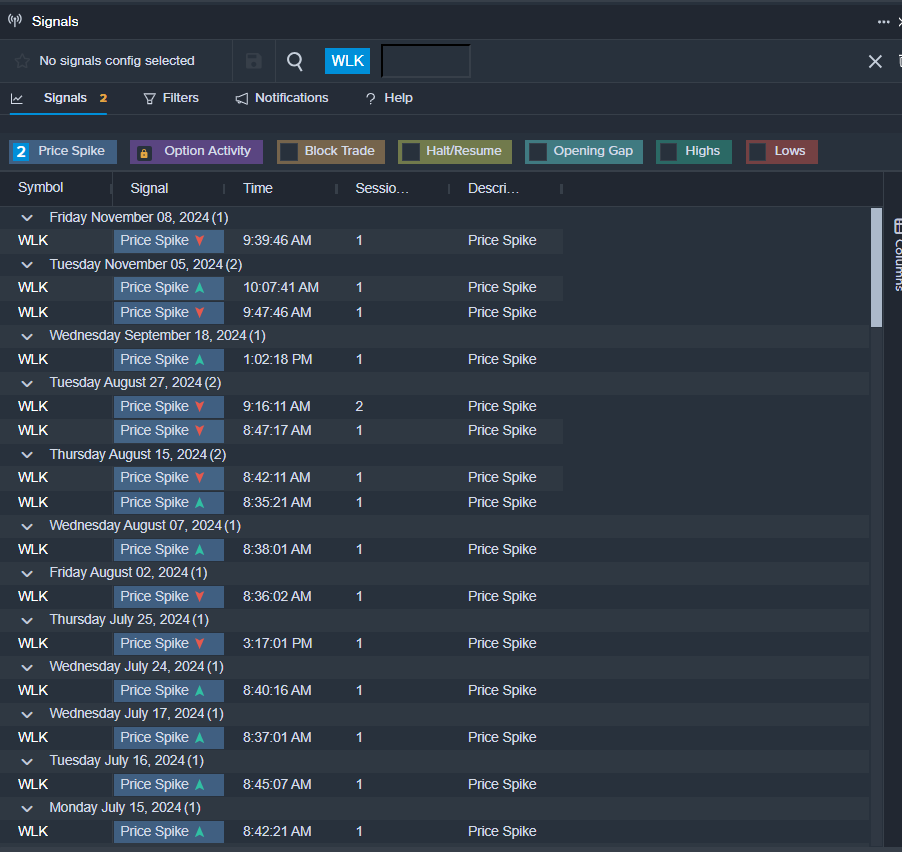
Benzinga Pro’s signals feature notified of a potential breakout in WLK shares.
Analysts expect the New York-based company to report quarterly earnings at $1.21 per share, up from 84 cents per share in the year-ago period. Citigroup projects quarterly revenue of $19.42 billion, compared to $17.44 billion a year earlier, according to data from Benzinga Pro.
On Monday, Barclays upgraded the stock from Equal-Weight to Overweight and raised its price target from $70 to $95.
With the recent buzz around Citigroup, some investors may be eyeing potential gains from the company’s dividends too. As of now, Citigroup offers an annual dividend yield of 3.08%, which is a quarterly dividend amount of 56 cents per share ($2.24 a year).
So, how can investors exploit its dividend yield to pocket a regular $500 monthly?
To earn $500 per month or $6,000 annually from dividends alone, you would need an investment of approximately $194,870 or around 2,679 shares. For a more modest $100 per month or $1,200 per year, you would need $39,989 or around 536 shares.
To calculate: Divide the desired annual income ($6,000 or $1,200) by the dividend ($2.24 in this case). So, $6,000 / $2.24 = 2,679 ($500 per month), and $1,200 / $2.24 = 536 shares ($100 per month).
Note that dividend yield can change on a rolling basis, as the dividend payment and the stock price both fluctuate over time.
How that works: The dividend yield is computed by dividing the annual dividend payment by the stock’s current price.
For example, if a stock pays an annual dividend of $2 and is currently priced at $50, the dividend yield would be 4% ($2/$50). However, if the stock price increases to $60, the dividend yield drops to 3.33% ($2/$60). Conversely, if the stock price falls to $40, the dividend yield rises to 5% ($2/$40).
Similarly, changes in the dividend payment can impact the yield. If a company increases its dividend, the yield will also increase, provided the stock price stays the same. Conversely, if the dividend payment decreases, so will the yield.
C Price Action: Shares of Citi gained 2.5% to close at $72.74 on Monday.
Analysts expect RPM International Inc. (NYSE:RPM) to report second-quarter earnings at $1.34 per share before the opening bell, on Tuesday, Jan. 7, 2025. That’s up from $1.22 per share in the year-ago period.
The Medina, Ohio-based company projects quarterly revenue of $1.79 billion, compared to $1.79 billion a year earlier, according to data from Benzinga Pro. On Oct. 2, RPM International reported first-quarter results. Sales declined 2.1% Y/Y to $1.97 billion, missing the consensus of $2.015 billion.
With the recent buzz around RPM International, some investors may be eyeing potential gains from its dividends. The company currently offers an annual dividend yield of 1.63%. That’s a quarterly dividend of 51 cents per share ($2.04 a year).
So, how can investors exploit its dividend yield to pocket a regular $500 monthly?
To earn $500 per month or $6,000 annually from dividends alone, you would need an investment of approximately $368,860 or around 2,941 shares. For a more modest $100 per month or $1,200 per year, you would need $73,747 or around 588 shares.
To calculate: Divide the desired annual income ($6,000 or $1,200) by the dividend ($2.04 in this case). So, $6,000 / $2.04 = 2,941 ($500 per month), and $1,200 / $2.04 = 588 shares ($100 per month).
Note that dividend yield can change on a rolling basis, as the dividend payment and the stock price both fluctuate over time.
How that works: The dividend yield is computed by dividing the annual dividend payment by the stock’s current price.
For example, if a stock pays an annual dividend of $2 and is currently priced at $50, the dividend yield would be 4% ($2/$50). However, if the stock price increases to $60, the dividend yield drops to 3.33% ($2/$60). Conversely, if the stock price falls to $40, the dividend yield rises to 5% ($2/$40).
Similarly, changes in the dividend payment can impact the yield. If a company increases its dividend, the yield will also increase, provided the stock price stays the same. Conversely, if the dividend payment decreases, so will the yield.
RPM Price Action: Shares of RPM fell 0.6% to close at $125.42 on Thursday.
The most oversold stocks in the information technology sector presents an opportunity to buy into undervalued companies.
The RSI is a momentum indicator, which compares a stock’s strength on days when prices go up to its strength on days when prices go down. When compared to a stock’s price action, it can give traders a better sense of how a stock may perform in the short term. An asset is typically considered oversold when the RSI is below 30, according to Benzinga Pro.
Here’s the latest list of major oversold players in this sector, having an RSI near or below 30.
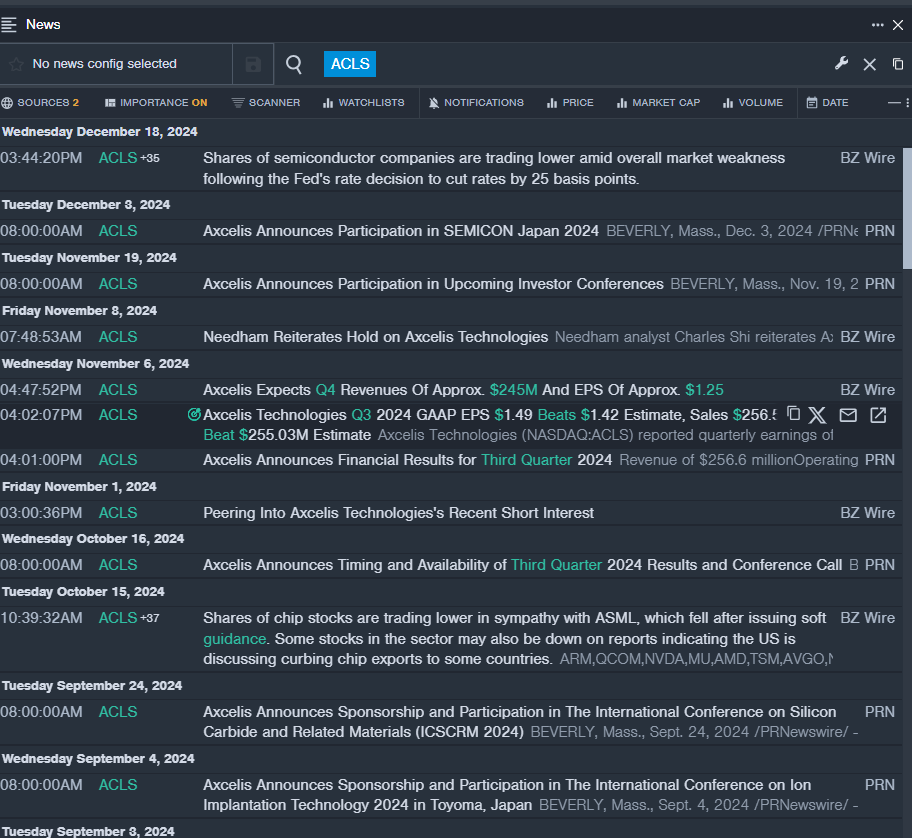
On Nov. 6, Axcelis Technologies posted better-than-expected quarterly earnings. President and CEO Russell Low commented, “Axcelis executed well in the third quarter with results relatively in-line with our expectations. While we anticipate a near term digestion of mature node capacity through the first half of 2025, customer engagement is strong and our long-term growth opportunity remains squarely intact highlighted by attractive secular growth in silicon carbide, a cyclical recovery in our memory and general mature markets, market share gains in advanced logic and regional penetration of the Japan market.” The company’s stock fell around 9% over the past five days and has a 52-week low of $68.79.
RSI Value: 29.60
ACLS Price Action: Shares of Axcelis Technologies fell 2.5% to close at $69.18 on Thursday.
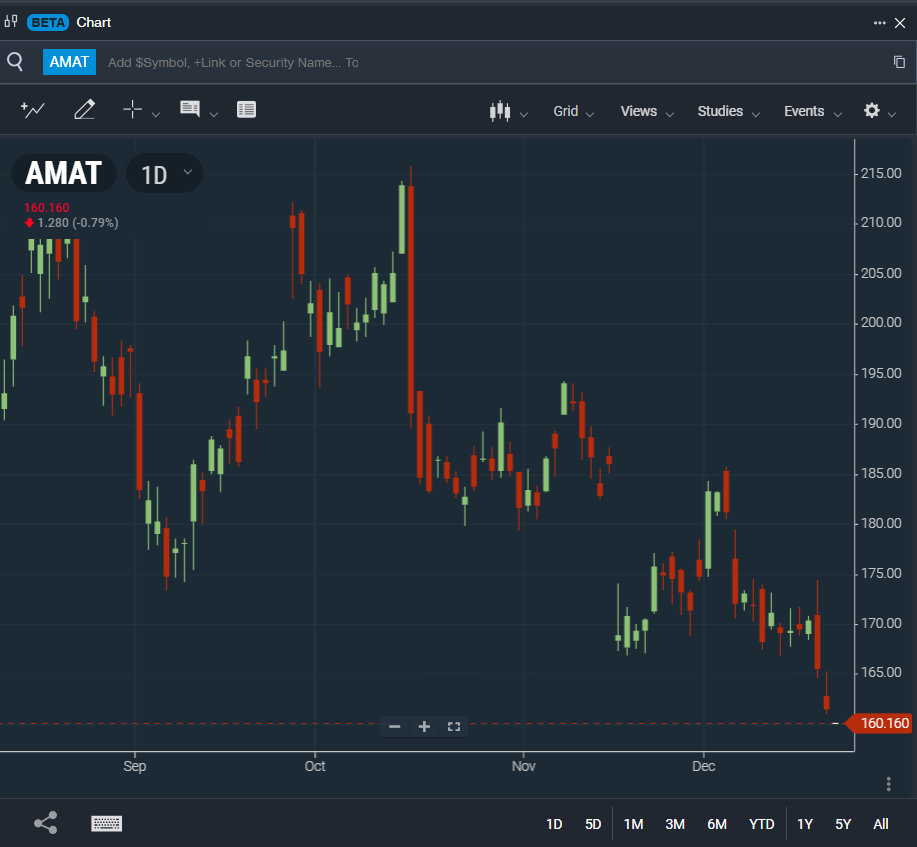
On Dec. 6, Wells Fargo analyst Joseph Quatrochi maintained the stock with an Overweight rating and lowered the price target from $220 to $210.. The company’s stock fell around 4% over the past five days and has a 52-week low of $148.06.
RSI Value: 29.31
AMAT Price Action: Shares of Applied Materials fell 2.4% to close at $161.44 on Thursday.
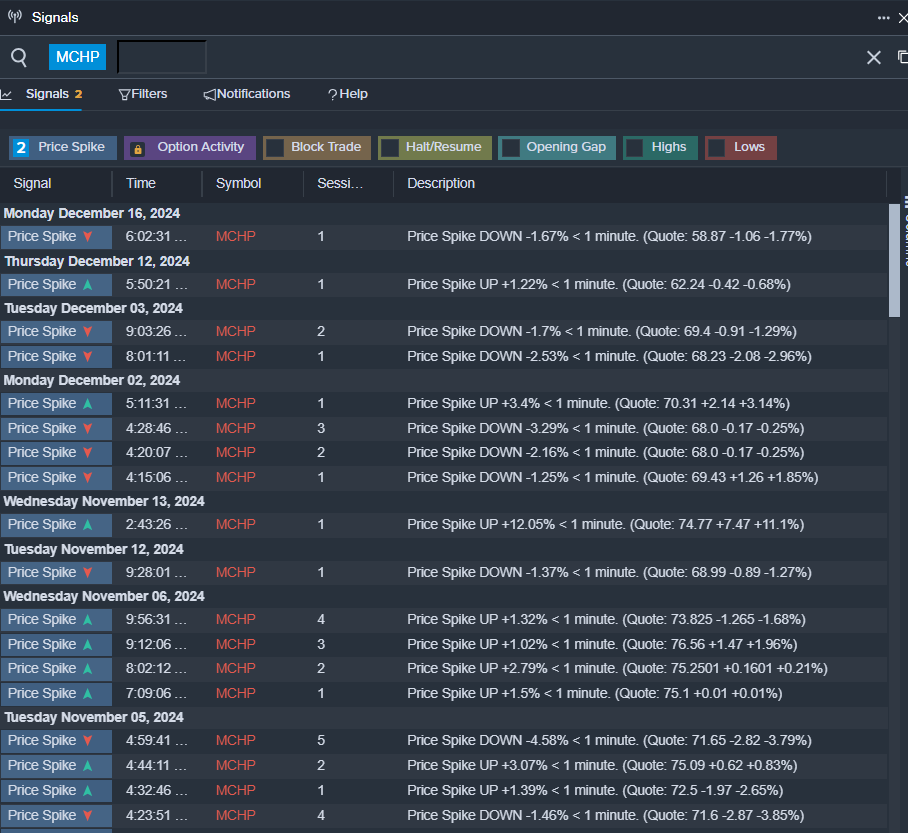
On Dec. 11, Stifel analyst Nathan Jones maintained A.O. Smith with a Buy and lowered the price target from $91 to $90. The company’s stock fell around 14% over the past month and has a 52-week low of $55.90.
RSI Value: 27.86
MCHP Price Action: Shares of Microchip Technology fell 0.3% to close at $55.99 on Thursday.