As of May 30, 2025, two stocks in the real estate sector could be flashing a real warning to investors who value momentum as a key criteria in their trading decisions.
The RSI is a momentum indicator, which compares a stock’s strength on days when prices go up to its strength on days when prices go down. When compared to a stock’s price action, it can give traders a better sense of how a stock may perform in the short term. An asset is typically considered overbought when the RSI is above 70, according to Benzinga Pro.
Here’s the latest list of major overbought players in this sector.
On May 1, Douglas Elliman reported better-than-expected first-quarter sales results. “Our performance in the first quarter highlights the strength of our luxury brand and the incredible efforts of our agents, employees and leadership team,” said Michael S. Liebowitz, Chief Executive Officer of Douglas Elliman Inc. “By focusing on high-impact areas like Development Marketing, we’re driving growth and reinforcing our position as the leader in the luxury market – delivering our highest first-quarter revenue since 2022 with significant reductions in operating losses.” The company’s stock jumped around 76% over the past month and has a 52-week high of $3.20.
RSI Value: 79.4
DOUG Price Action: Shares of Douglas Elliman fell 1% to close at $2.92 on Thursday.
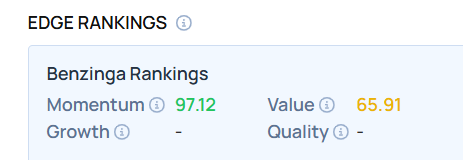
Edge Stock Ratings: 97.12 Momentum score with Value at 65.91.
On May 20, Evercore ISI Group analyst Steve Sakwa upgraded Paramount Group from In-Line to Outperform and raised the price target from $4.5 to $8. The company’s stock gained around 42% over the past month and has a 52-week high of $6.34.
RSI Value: 78
PGRE Price Action: Shares of Paramount fell 2.6% to close at $6.09 on Thursday.
Toll Brothers, Inc. (NYSE:TOL) will release its second-quarter earnings results after the closing bell on Tuesday, May 20.
Analysts expect the Fort Washington, Pennsylvania-based company to report quarterly earnings at $2.86 per share, down from $4.75 per share in the year-ago period. Toll Brothers projects to report quarterly revenue at $2.49 billion, compared to $2.84 billion a year earlier, according to data from Benzinga Pro.
On May 15, Oppenheimer analyst Tyler Batory maintained Toll Brothers with an Outperform rating and lowered the price target from $165 to $155.
With the recent buzz around Toll Brothers, some investors may be eyeing potential gains from the company’s dividends too. As of now, Toll Brothers offers an annual dividend yield of 0.93%. That’s a quarterly dividend of 25 cents per share ($1.00 a year).
So, how can investors exploit its dividend yield to pocket a regular $500 monthly?
To earn $500 per month or $6,000 annually from dividends alone, you would need an investment of approximately $643,560 or around 6,000 shares. For a more modest $100 per month or $1,200 per year, you would need $128,712 or around 1,200 shares.
To calculate: Divide the desired annual income ($6,000 or $1,200) by the dividend ($1.00 in this case). So, $6,000 / $1.00 = 6,000 ($500 per month), and $1,200 / $1.00 = 1,200 shares ($100 per month).
Note that dividend yield can change on a rolling basis, as the dividend payment and the stock price both fluctuate over time.
How that works: The dividend yield is computed by dividing the annual dividend payment by the stock’s current price.
For example, if a stock pays an annual dividend of $2 and is currently priced at $50, the dividend yield would be 4% ($2/$50). However, if the stock price increases to $60, the dividend yield drops to 3.33% ($2/$60). Conversely, if the stock price falls to $40, the dividend yield rises to 5% ($2/$40).
Similarly, changes in the dividend payment can impact the yield. If a company increases its dividend, the yield will also increase, provided the stock price stays the same. Conversely, if the dividend payment decreases, so will the yield.
TOL Price Action: Shares of Toll Brothers gained 0.8% to close at $107.26 on Friday.
As of May 16, 2025, three stocks in the consumer discretionary sector could be flashing a real warning to investors who value momentum as a key criteria in their trading decisions.
The RSI is a momentum indicator, which compares a stock’s strength on days when prices go up to its strength on days when prices go down. When compared to a stock’s price action, it can give traders a better sense of how a stock may perform in the short term. An asset is typically considered overbought when the RSI is above 70, according to Benzinga Pro.
Here’s the latest list of major overbought players in this sector.
On April 28, Leggett & Platt reported better-than-expected first-quarter EPS results and raised its FY25 EPS guidance. President and CEO Karl Glassman commented, “We are pleased to report better than anticipated first quarter earnings. Our earnings improvement is a testament to the excellent execution of our restructuring plan and operational efficiency improvement initiatives, as well as disciplined cost management.” The company’s stock jumped around 46% over the past month and has a 52-week high of $14.24.
RSI Value: 70.2
LEG Price Action: Shares of Leggett & Platt gained 0.8% to close at $9.55 on Thursday.
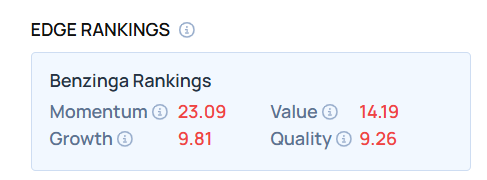
Edge Stock Ratings: 23.09 Momentum score with Value at 14.19.
On May 14, Fossil Group reported a year-over-year increase in first-quarter adjusted EPS results. “We are pleased to deliver another quarter of progress under our turnaround plan,” said Franco Fogliato, CEO. The company’s stock gained around 59% over the past month and has a 52-week high of $2.61.
RSI Value: 80.2
FOSL Price Action: Shares of Fossil gained 15.9% to close at $1.46 on Thursday.
On May 1, Laureate Education reported better-than-expected first-quarter financial results and raised its FY25 sales guidance. The company’s stock gained around 17% over the past month and has a 52-week high of $23.61.
RSI Value: 72.5
LAUR Price Action: Shares of Laureate Education gained 0.7% to close at $22.64 on Thursday.
Arm Holdings reported quarterly earnings of 55 cents per share, which beat the analyst consensus estimate of 52 cents. Quarterly revenue came in at $1.24 billion, which beat the consensus estimate of $1.23 billion.
“Arm delivered record-breaking results for both the fourth quarter and the full fiscal year ending 2025. We surpassed $1 billion in revenue for the first time in Q4, driven by increased deployment of our CSS platforms across AI data center, cloud compute and mobile. As AI growth from the cloud to the edge creates demand for more energy-efficient compute, Arm will enable AI everywhere,” said Rene Haas, CEO of Arm Holdings.
Arm said it sees fiscal 2026 EPS in a range of $1.56 to $1.64, versus the $2.03 estimate, and revenue in a range of $3.94 billion to $4.04 billion, versus the $4.91 billion analyst estimate.
Arm Holdings shares fell 5.6% to trade at $117.09 on Thursday.
These analysts made changes to their price targets on Arm Holdings following earnings announcement.
Guggenheim analyst John Difucci maintained ARM with a Buy and lowered the price target from $180 to $147.
Wells Fargo analyst Joe Quatrochi maintained the stock with an Overweight rating and lowered the price target from $150 to $145.
Rosenblatt analyst Kevin Cassidy maintained ARM Holdings with a Buy and lowered the price target from $203 to $180.
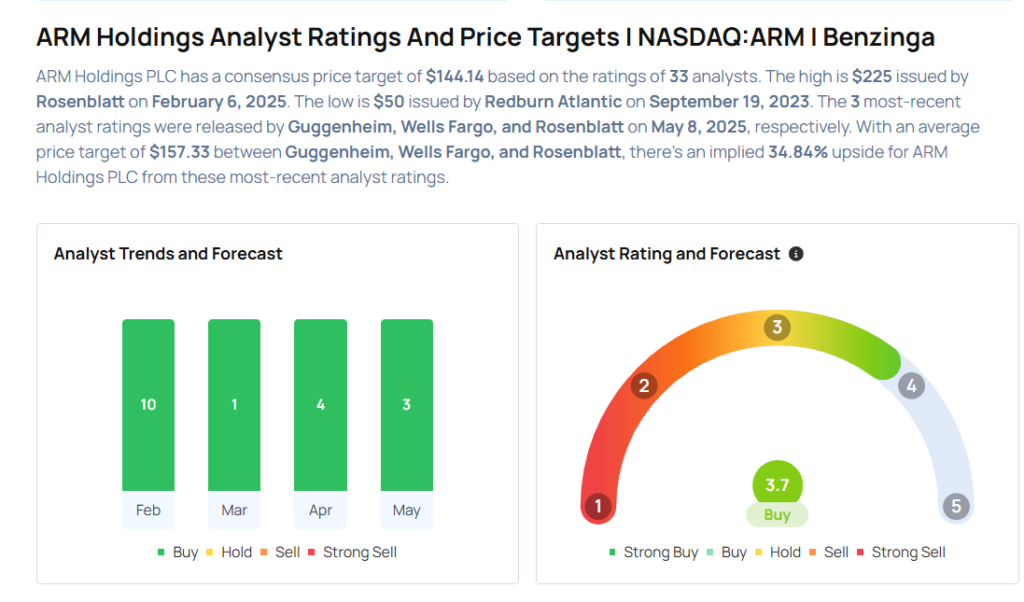
Considering buying ARM stock? Here’s what analysts think:
As of May 6, 2025, two stocks in the energy sector could be flashing a real warning to investors who value momentum as a key criteria in their trading decisions.
The RSI is a momentum indicator, which compares a stock’s strength on days when prices go up to its strength on days when prices go down. When compared to a stock’s price action, it can give traders a better sense of how a stock may perform in the short term. An asset is typically considered overbought when the RSI is above 70, according to Benzinga Pro.
Here’s the latest list of major overbought players in this sector.
Teekay will release their financial results for the first quarter after the closing bell on Wednesday, May 7. Analysts expect the company to report quarterly earnings at $1.15 per share on revenue of $144.85 million. The company’s stock jumped around 23% over the past month and has a 52-week high of $74.20.
RSI Value: 73.8
TNK Price Action: Shares of Teekay Tankers jumped 4.7% to close at $46.17 on Monday.
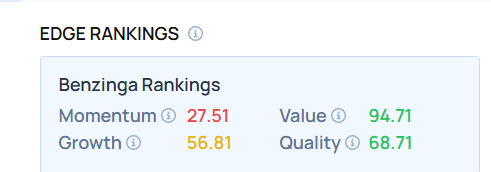
Edge Stock Ratings: 27.51 Momentum score with Value at 94.71.
On April 22, Evercore ISI Group analyst Jonathan Chappell maintained Frontline with an Outperform rating and lowered the price target from $22 to $20. The company’s stock gained around 24% over the past month and has a 52-week high of $29.39.
RSI Value: 70.5
FRO Price Action: Shares of Frontline gained 3.9% to close at $17.79 on Monday.
As of May 2, 2025, three stocks in the communication services sector could be flashing a real warning to investors who value momentum as a key criteria in their trading decisions.
The RSI is a momentum indicator, which compares a stock’s strength on days when prices go up to its strength on days when prices go down. When compared to a stock’s price action, it can give traders a better sense of how a stock may perform in the short term. An asset is typically considered overbought when the RSI is above 70, according to Benzinga Pro.
Here’s the latest list of major overbought players in this sector.
QuinStreet will report financial results for its third quarter after the market closes on Wednesday, May 7. The company’s stock jumped around 8% over the past five days and has a 52-week high of $26.27.
RSI Value: 70.4
QNST Price Action: Shares of QuinStreet jumped 6.8% to close at $18.71 on Thursday.
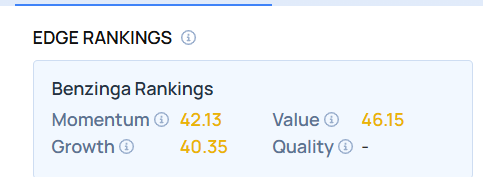
Edge Stock Ratings: 42.13 Momentum score with Value at 46.15.
On May 1, Emerald Holding reported better-than-expected first-quarter financial results and issued FY25 sales guidance with its midpoint above estimates. Hervé Sedky, Emerald’s President and Chief Executive Officer, said, “Our strong first-quarter performance underscores the meaningful progress we’ve made in executing our strategy and delivering value to both our customers and shareholders.” The company’s stock gained around 18% over the past five days and has a 52-week high of $6.74.
RSI Value: 78
EEX Price Action: Shares of Emerald Holding gained 15% to close at $4.52 on Thursday.
HUYA will report its first quarter unaudited financial results on Tuesday, May 13, before the opening bell. The company’s stock gained around 15% over the past month and has a 52-week high of $6.84.
RSI Value: 70.3
HUYA Price Action: Shares of HUYA gained 1.6% to close at $3.82 on Thursday.
As of April 25, 2025, two stocks in the health care sector could be flashing a real warning to investors who value momentum as a key criteria in their trading decisions.
The RSI is a momentum indicator, which compares a stock’s strength on days when prices go up to its strength on days when prices go down. When compared to a stock’s price action, it can give traders a better sense of how a stock may perform in the short term. An asset is typically considered overbought when the RSI is above 70, according to Benzinga Pro.
Here’s the latest list of major overbought players in this sector.
On March 28, Lexicon Pharmaceuticals entered into an exclusive license agreement with Novo Nordisk A/S (NYSE:NVO) for LX9851, a first-in-class, oral non-incretin development candidate in obesity and associated metabolic disorders. Under the terms of the agreement, Novo Nordisk obtains an exclusive, worldwide license to develop, manufacture, and commercialize LX9851 in all indications. The company’s stock jumped around 95% over the past month and has a 52-week high of $2.45.
RSI Value: 73.9
LXRX Price Action: Shares of Lexicon Pharmaceuticals gained 4.7% to close at $0.70 on Thursday.
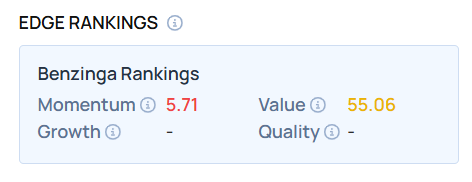
Edge Stock Ratings: 5.71 Momentum score with Value at 55.06.
On March 12, Amarin announced its intent to effect a 1-for-20 ADS ratio change. The company also reported fourth-quarter financial results. “Since taking on the role of CEO of Amarin last year, I have worked with our leadership team and the Board of Directors to identify opportunities to leverage our unique assets, skills and resources to drive value,” said Aaron Berg, President & CEO, Amarin. “In 2024, while still progressing with the early launch in markets outside the U.S. and despite a dynamic generic market in the U.S., we generated more than $200 million in revenue and ended the year with nearly $300 million in cash and no debt — all measures exemplifying the strength and resilience of our franchise and the impact of our disciplined approach to capital deployment.” The company’s stock gained around 24% over the past five days and has a 52-week high of $20.60.
RSI Value: 73.5
AMRN Price Action: Shares of Amarin rose 7.9% to close at $11.18 on Thursday.
As of April 23, 2025, two stocks in the consumer discretionary sector could be flashing a real warning to investors who value momentum as a key criteria in their trading decisions.
The RSI is a momentum indicator, which compares a stock’s strength on days when prices go up to its strength on days when prices go down. When compared to a stock’s price action, it can give traders a better sense of how a stock may perform in the short term. An asset is typically considered overbought when the RSI is above 70, according to Benzinga Pro.
Here’s the latest list of major overbought players in this sector.
ThredUp will release its financial results for the first quarter on Monday, May 5, after the close of the U.S. markets. The company’s stock jumped around 37% over the past month and has a 52-week high of $3.89.
RSI Value: 83.2
TDUP Price Action: Shares of ThredUp gained 15.3% to close at $3.85 on Tuesday.
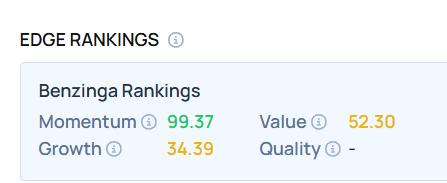
Edge Stock Ratings: 99.37 Momentum score with Value at 52.30.
On April 18, AMMO completed the sale of ammunition manufacturing assets to Olin Winchester. “This transaction marks a defining moment in AMMO’s evolution,” said Christos Tsentas, Chair of the Board’s M&A Committee. “After a thorough strategic review and collaboration with our financial and legal advisors, we are confident this sale will unlock significant value and enable AMMO to accelerate growth as a pure-play e-commerce platform.” The company’s stock gained around 35% over the past five days and has a 52-week high of $2.86.
RSI Value: 81.4
POWW Price Action: Shares of Ammo rose 15.4% to close at $1.80 on Tuesday.
The CNN Money Fear and Greed index showed further decline in the overall market sentiment, while the index remained in the “Extreme Fear” zone on Friday.
U.S. stocks settled lower on Friday, with the Dow Jones index tumbling over 2,200 points during the session.
Tesla Inc. (NASDAQ:TSLA) shares dipped over 10% on Friday, Nvidia Corp. (NASDAQ:NVDA) lost 7.4%, while Apple Inc. (NASDAQ:AAPL) dipped 7.3% during the session.
On the economic data front, in March, nonfarm payrolls surged by 228,000, the Bureau of Labor Statistics reported Friday. The outcome is well above the three-month average of 195,000 and topped economists’ forecasts of 135,000. February’s employment growth was downwardly revised to 117,000. The unemployment rate unexpectedly inched higher from 4.1% to 4.2%, defying expectations for no change. Average hourly earnings increased 0.3% from February’s pace, as predicted, and rose 3.8% year-over-year, marginally lower than the 3.9% predicted.
Most sectors on the S&P 500 closed on a negative note, with financial, energy, and information technology stocks recording the biggest losses on Friday. However, consumer staples stocks bucked the overall market trend, closing the session higher.
The Dow Jones closed lower by around 2,231 points to 38,314.86 on Friday. The S&P 500 dipped 5.97% to 5,074.08, while the Nasdaq Composite tumbled 5.82% to 15,587.79 during Friday’s session.
Investors are awaiting earnings results from Levi Strauss & Co. (NYSE:LEVI), Dave & Buster’s Entertainment, Inc. (NASDAQ:PLAY), and The Greenbrier Companies Inc. (NYSE:GBX) today.
What is CNN Business Fear & Greed Index?
At a current reading of 4.2, the index remained in the “Extreme Fear” zone on Friday, versus a prior reading of 6.0.
The Fear & Greed Index is a measure of the current market sentiment. It is based on the premise that higher fear exerts pressure on stock prices, while higher greed has the opposite effect. The index is calculated based on seven equal-weighted indicators. The index ranges from 0 to 100, where 0 represents maximum fear and 100 signals maximum greediness.
Analysts expect the company to report quarterly earnings at $1.83 per share, up from $1.68 per share in the year-ago period. Jabil projects quarterly revenue of $6.4 billion, compared to $6.77 billion a year earlier, according to data from Benzinga Pro.
On Feb. 24, Goldman Sachs analyst Mark Delaney maintained Jabil with a Buy and raised the price target from $160 to $179.
With the recent buzz around Jabil, some investors may be eyeing potential gains from the company’s dividends too. Currently, Jabil offers an annual dividend yield of 0.24%, a quarterly dividend amount of 8 cents per share (32 cents a year).
So, how can investors exploit its dividend yield to pocket a regular $500 monthly?
To earn $500 per month or $6,000 annually from dividends alone, you would need an investment of approximately $2,542,875 or around 18,750 shares. For a more modest $100 per month or $1,200 per year, you would need $508,575 or around 3,750 shares.
To calculate: Divide the desired annual income ($6,000 or $1,200) by the dividend (32 cents in this case). So, $6,000 / $0.32 = 18,750 ($500 per month), and $1,200 / $0.32 = 3,750 shares ($100 per month).
Note that dividend yield can change on a rolling basis, as the dividend payment and the stock price both fluctuate over time.
How that works: The dividend yield is computed by dividing the annual dividend payment by the stock’s current price.
For example, if a stock pays an annual dividend of $2 and is currently priced at $50, the dividend yield would be 4% ($2/$50). However, if the stock price increases to $60, the dividend yield drops to 3.33% ($2/$60). Conversely, if the stock price falls to $40, the dividend yield rises to 5% ($2/$40).
Similarly, changes in the dividend payment can impact the yield. If a company increases its dividend, the yield will also increase, provided the stock price stays the same. Conversely, if the dividend payment decreases, so will the yield.
Price Action: Shares of Jabil fell 2% to close at $135.62 on Tuesday.