Utz Brands, Inc.(NYSE:UTZ) shares are surging on Tuesday as the company disclosed a definitive deal with Intersnack Group to take Utz private for an enterprise value of $2.9 billion.
As per the deal, Intersnack will acquire all outstanding shares of Utz’s Class A common stock for $14.25 per share in cash. This represented a premium of approximately 91% over the closing price from July 20, 2026.
Utz To Go Private
The transaction will be financed through approximately $920 million in cash from Intersnack Group, borrowings under a new $1.1 billion term loan facility, and a new $250 million asset-based lending (ABL) facility.
Funding will also include rollover equity from the Rice and Lissette Family, along with the reinvestment of a portion of proceeds from the $44 million settlement of the Company’s tax receivable agreement related to the transaction.
Notably, the Rice and Lissette Family, Dylan Lissette, and certain affiliates have agreed to support the transaction by voting their shares in favor of the deal. The committed shares represent approximately 42% of Utz’s outstanding common stock.
This transaction is expected to close in the fourth quarter of 2026, pending regulatory approvals and shareholder votes.
Post-deal closure, the Rice and Lissette Family will retain a significant ownership stake, with both parties owning 50% of Utz post-transaction, which aims to enhance Utz’s growth potential in the U.S. snack market.
UTZ Earnings Preview And Analyst Ratings
The countdown is on: Utz is set to report earnings on August 5, 2026 (confirmed).
EPS Estimate: 18 cents (Up from 17 cents YoY)
Revenue Estimate: $374.53 Million (Up from $366.70 Million YoY)
Analyst Consensus & Recent Actions: The stock carries a Buy rating with an average price forecast of $9.33. Recent analyst moves include:
UBS: Neutral (Lowers Target to $8.00) (July 16)
Barclays: Overweight (Lowers Target to $10.00) (April 15)
BTIG: Initiated with Buy (Target $10.00) (April 14)
UTZ Technical Outlook After Buyout News
The stock’s recent surge comes after a prolonged downtrend, with a 12-month performance decline of nearly 47%. Currently, Utz is trading significantly above its moving averages, with the price approximately 83.8% above its 20-day simple moving average (SMA) of $7.63 and 89.4% above its 50-day SMA of $7.40.
The Relative Strength Index (RSI) is at 47.12, indicating a neutral momentum, suggesting that while the stock is experiencing upward movement, it is not yet overbought. This could imply that there is still room for further gains if the momentum continues.
Key Resistance: $14.25 — this level is critical as it represents the acquisition price set by Intersnack Group.
Key Support: $12.00 — a nearby level where buyers previously stepped in, indicating potential support.
What Utz Brands (UTZ) Makes And Key Snack Brands
Utz Brands is a manufacturer of branded salty snacks based in the United States. It produces various salty snack foods, including potato chips, tortilla chips, pretzels, cheese snacks, party mixes, pork skins, ready-to-eat popcorn, and other snacks, which include salsa and dips. These products are offered through its flagship brands like Utz, On The Border, Zapp’s, and Boulder Canyon, along with other brands, including Golden Flake, Miguelito’s, Hawaiian, Bachman, Tim’s Cascade, Dirty Potato Chips, TGI Fridays, and Vitner’s.
The recent acquisition news is significant as it indicates a strategic move to enhance Utz’s market position and access to resources for growth. With Intersnack’s extensive experience in the snack industry, this partnership could lead to innovative product development and expanded market reach.
How Utz Ranks On Momentum And Value
Below is the Benzinga Edge scorecard for Utz Brands, highlighting its strengths and weaknesses compared to the broader market:
Value: Weak (Score: 28.06) — Trading at a steep premium relative to peers.
The Verdict: Utz Brands’s Benzinga Edge signal reveals a weak profile, particularly in momentum and value, indicating challenges in sustaining its recent price surge. Investors should monitor upcoming earnings and the impact of the acquisition on future performance.
UTZ Price Action: Utz Brands shares were up 88.93% at $14.07 at the time of publication on Tuesday. The stock is approaching its 52-week high of $14.67, according to Benzinga Pro data.
Owning stocks while collecting a fat monthly income sounds like financial alchemy. Yet, that’s the premise behind the market’s latest darling – covered call ETFs.
Two popular funds, like JPMorgan Equity Premium Income ETF (NYSE:JEPI) and Global X NASDAQ 100 Covered Call ETF (NASDAQ:QYLD) have swelled to over $53 billion in assets as investors chase yields that can look bond-like or better, but arrive with the gloss of equity exposure.
The problem is timing. If buyers use these products while also betting that the bull market has further to run, it is a contradiction, since these funds trade away part of tomorrow’s upside for cash today.
Capping the Growth
A covered call fund holds equities, then sells call options against them. The premium collected becomes the income that gets distributed to shareholders. In return, the fund hands the option buyer the right to the gains above a set strike price.
In flat or choppy markets, a covered call might be a smart way to harvest yield from a stagnant portfolio. Yet, in a rally it becomes a self-inflicted wound. When an underlying index decisively moves higher, the upside is clipped. Shareholders pocket the distribution but surrender a large share of capital appreciation.
For that reason, tech-heavy covered call funds can dramatically lag their benchmarks during strong advances. A fund writing calls on Nasdaq-100 exposure may advertise a double-digit distribution yield, yet still trail the Invesco QQQ Trust(NASDAQ:QQQ) by a wide margin when megacap technology stocks are ripping higher.
The gap doesn’t always feel like a fee because it isn’t deducted from the expense ratio. But economically, it can behave like one – an invisible cost paid in foregone gains.
These costs add up because total return, not yield, is what builds wealth. A 10% distribution is not a 10% profit if the fund’s price stagnates, declines, or fails to keep pace with the market. Investors who reinvest those payouts may still compound, but they are compounding from a strategy that deliberately sells off the most explosive part of equity returns.
Taxation and Compounding
The income these funds provide often derives from option premiums, and much of it is taxed less favorably than investors assume. According to SoFi, funds that write options on individual equities typically generate distributions taxed at ordinary income rates, which may reach up to 37% for higher earners — whereas funds using broad-based index options may qualify for more favorable Section 1256 treatment.
That situation rewrites the arithmetic. A yield that looks irresistible on screen can shrink dramatically once the IRS is paid. And because the tax hits every month or quarter, it repeatedly interrupts compounding — instead of letting gains ride untaxed inside an index fund until you sell, you are forced to recognize income the whole way up.
None of this makes covered call ETFs bad products. They can serve a purpose for investors who need current cash flow, want lower volatility, or expect sideways markets.
But they are poor substitutes for growth funds in a bull market. The trap is that investors might think they can collect high income while participating in a rally. In reality, free lunches in any market are exceptionally rare.
Three gold miners, two asset-management giants and a high-flying semiconductor were among the large-cap movers on the pre-market board following a cooler-than-expected producer inflation report on Wednesday.
Producer prices fell 0.3% in June, the softest monthly print since April 2025, a day after consumer inflation posted its steepest monthly decline since April 2020.
According to Benzinga Pro data, here are the best-performing stocks with a market cap above $50 billion in the 30 minutes of pre-market trading following the release, from 8:30 a.m. to 9:00 a.m. ET.
10. Robinhood Markets Inc.
Robinhood Markets Inc. (NASDAQ:HOOD) rose 1.04%. As stock futures rose, retail brokerages carry a direct link to risk appetite, and a market pricing a less aggressive rate path is a market that trades more.
9. Barrick Mining Corp.
Barrick Mining Corp. (NYSE:B) added 1.04%, as gold advanced 0.46% to $4,058.78 an ounce.
Agnico Eagle Mines Ltd. (NYSE:AEM) rose 1.16%, reflecting gold’s rebound.
4. BlackRock Inc.
BlackRock Inc. (NYSE:BLK) gained 1.20%, fueled by strong-than-expected second quarter earnings.
3. Bloom Energy Corp.
Bloom Energy Corp. (NYSE:BE) advanced 1.23%, as lower Treasury yields helped stocks with high multiples.
2. Newmont Corp.
Newmont Corp.(NYSE:NEM) rose 1.29%, the largest gold producer on the list and the second-best performer on the board.
1. Bank of Nova Scotia
Bank of Nova Scotia(NYSE:BNS) led the entire board at 1.99%. A softer dollar and a lower North American front end both cut in the bank’s favor, and it is the only commercial lender on the board.
Top Large-Cap Gainers After June PPI
Rank
Ticker
Company
Price
Change
1
BNS
Bank of Nova Scotia
$90.52
+1.99%
2
NEM
Newmont Corp.
$95.22
+1.29%
3
BE
Bloom Energy Corp.
$247.72
+1.23%
4
BLK
BlackRock Inc.
$1,080.00
+1.20%
5
AEM
Agnico Eagle Mines Ltd.
$145.00
+1.16%
6
MRVL
Marvell Technology Inc.
$224.95
+1.10%
7
SHOP
Shopify Inc.
$126.00
+1.08%
8
BX
Blackstone Inc.
$126.88
+1.05%
9
B
Barrick Mining Corp.
$36.60
+1.04%
10
HOOD
Robinhood Markets Inc.
$114.58
+1.04%
Source: Benzinga Pro – 8:30 a.m. – 9:00 a.m. ET pre-market | Market cap > $50B | July 15, 2026
Why The Gold Complex Did The Heavy Lifting
Newmont, Agnico Eagle and Barrick occupied three of the 10 slots. Miners are a levered claim on the metal, and the metal is a claim on real rates.
As traders trim the odds of further Fed hikes, gold — among the most heavily penalized assets of recent months — catches a bid.
PepsiCo Inc. (NASDAQ:PEP) said higher gasoline prices, partly driven by geopolitical tensions, weighed on consumer spending during the second quarter, particularly in convenience stores where impulse purchases slowed.
During the earnings call, management said consumers continued to visit convenience stores but were less likely to make purchases as higher fuel costs pressured discretionary spending.
The comments followed the company’s mixed second-quarter results released Thursday. Revenue rose 6.4% year over year to $24.18 billion, topping analysts’ estimate of $23.96 billion. However, core earnings of $2.20 per share missed the consensus estimate of $2.21 per share.
PepsiCo delivered 7% revenue growth in the first half of 2026, with global food volumes rising 3% and beverage volumes increasing 2%, marking its strongest first-half volume growth since 2022.
The company is investing in affordability initiatives and expanding its portfolio, particularly in permissible and portion-controlled products, to support U.S. volume growth.
International Segment Performance To Persist
Management expects strong international performance to continue through the second half of 2026, with momentum carrying into the summer season.
For the third quarter, management expects continued strength in international operations, gradual improvement in North America, and an approximately one percentage point boost to EPS from tariff refund claims. These refunds are expected to help mitigate commodity inflation while allowing PepsiCo to continue investing in growth initiatives.
The company also anticipates a higher year-over-year tax rate in the third quarter, with certain investments and operating expenses weighted more toward the quarter compared with the fourth quarter. Ongoing productivity initiatives are expected to continue through the third and fourth quarters to support future growth investments.
The company also anticipates improved growth across its U.S. Foods and U.S. Beverages businesses during the second half. PepsiCo continues to project organic sales growth at the lower end of its long-term target range of 4% to 6% for the period.
Higher Inflationary Pressure
PepsiCo expects higher commodity inflation in the second half, partially offset by tariff refund claims that are projected to add about one percentage point to full-year EPS growth.
Despite inflationary pressures, including higher fuel costs, PepsiCo expects its international business to remain strong. It continues to target the lower end of its long-term organic sales growth range for the second half.
PepsiCo Full Year Outlook
PepsiCo reaffirmed its fiscal 2026 guidance, projecting organic revenue growth of 2% to 4% and core constant currency EPS growth of 4% to 6%.
The company also maintained adjusted EPS guidance of $8.55 to $8.71, compared to the $8.64 estimate, and sales guidance of $97.68 billion to $99.56 billion, versus the $98.88 billion estimate.
Moreover, management reaffirmed its full-year guidance, supported by continued strength in international markets and gradual improvement in North America, though at a slower pace than previously expected after a softer second quarter.
The company expects its international business to surpass $40 billion in annual revenue this year and now accounts for roughly two-thirds of beverage volumes and more than half of food volumes.
PEP Price Action: PepsiCo shares were down 0.29% at $137.46 during premarket trading on Friday, according to Benzinga Pro data.
U.S. stock futures were mixed on Tuesday, as the Dow Jones index rose while the Nasdaq 100 and S&P 500 indices fell, following Monday’s higher close.
On Monday, President Donald Trump said the federal government has deposited the first $1,000 into more than 500,000 newly created “Trump Accounts,” launching a program aimed at giving eligible American newborns an early start in investing.
Meanwhile, the 10-year Treasury bond yielded 4.50%, and the two-year bond was at 4.13%. The CME Group’s FedWatch tool’s projections show markets pricing a 74.9% likelihood of the Federal Reserve leaving the current interest rates unchanged during July’s meeting.
Index
Performance (+/-)
Dow Jones
0.22%
S&P 500
-0.12%
Nasdaq 100
-0.81%
Russell 2000
0.08%
The SPDR S&P 500 ETF Trust (NYSE:SPY) and Invesco QQQ Trust ETF (NASDAQ:QQQ), which track the S&P 500 and Nasdaq 100, respectively, were lower in premarket on Tuesday. The SPY was down 0.14% at $750.24, while the QQQ declined by 0.93% to $716.11.
Space Exploration Technologies Corp.(NASDAQ:SPCX) was 2.14% lower after it joined the Nasdaq 100 index just 15 days after its stock market debut, despite expectations of billions in passive investment inflows.
Benzinga’s Edge Stock Rankings indicate that SPCX maintains a weak price trend in the medium, short, and long terms.
Micron Technology and Ford
Micron Technology Inc. (NASDAQ:MU) tumbled by 5.37%, and Ford Motor Co.(NYSE:F) was down 0.072% after both companies announced a long-term Strategic Customer Agreement on Monday. Under the agreement, Micron will expand production of key automotive memory solutions to help secure the supply chain for Ford’s next-generation vehicles.
Benzinga’s Edge Stock Rankings indicate that MU maintains a strong price trend in the long, short, and medium terms, with a good quality score.
Rivian Automotive
Rivian Automotive Inc.(NASDAQ:RIVN) dropped 7.70% as it announced an underwritten public offering of up to 75 million shares of common stock. It also reported impressive second-quarter production and delivery figures, surpassing its own expectations.
Benzinga’s Edge Stock Rankings indicate that RIVN maintains a strong price trend in the long, short, and medium terms.
RxSight
RxSight Inc. (NASDAQ:RXST) was 1.61% lower as it said that it sees second-quarter revenue of $32 million to $34 million and FY2026 revenue of $140 million to $160 million. It also announced a non-exclusive collaboration with Alcon to jointly develop adjustable presbyopia-correcting intraocular lenses.
Benzinga’s Edge Stock Rankings indicate that RXST maintains a weak price trend in the medium, short, and long terms.
Penguin Solutions
Penguin Solutions Inc. (NASDAQ:PENG) fell 1.80% as analysts expect it to report earnings of 54 cents per share on revenue of $405.53 million, after the closing bell.
Benzinga’s Edge Stock Rankings indicate that PENG maintains a strong price trend in the short, long, and medium terms, with a moderate growth score.
Information technology and communication services stocks were among the top gainers, while health care, real estate, and utilities stocks recorded the biggest losses on Monday, leading most sectors on the S&P 500 to close on a negative note. Amid a rebound in chip stocks, U.S. stocks settled higher on Monday, with the Nasdaq Composite gaining more than 1% during the session.
Index
Performance (+/-)
Value
Dow Jones
0.29%
53,055.91
S&P 500
0.72%
7,537.43
Nasdaq Composite
1.12%
26,121.16
Russell 2000
0.45%
3,009.54
Insights From Analysts
According to Dean Chen, the U.S. stock market and broader economy are entering a new phase defined by heightened “monetary policy uncertainty,” as the Federal Reserve pivots away from traditional forward guidance toward a strict data-dependent approach.
Chen notes that because the Fed is “reducing reliance on forward guidance,” market expectations will now hinge entirely on real-time data rather than preset signals.
Consequently, Chen expects increased market turbulence, warning that “policy uncertainty may drive higher volatility around inflation and employment releases.” Without the smoothing effect of forward guidance, asset prices will become far more sensitive to macroeconomic indicators.
Compounding this volatility are external pressures. Chen highlights that “Middle East tensions return as oil markets balance geopolitical risks and stable supply,” which could impact energy costs and inflation.
Additionally, international factors like Japan’s weak yen and fiscal strain will keep “demand for U.S. dollar assets elevated.” Ultimately, Chen expects a cautious, highly reactive environment for U.S. markets, where investors must closely parse incoming liquidity conditions and economic growth data to gauge market direction.
Upcoming Economic Data
Here’s what investors will be keeping an eye on Tuesday.
No data is scheduled to be released on Tuesday.
Commodities, Crypto, And Global Equity Markets
Crude oil futures were trading higher in the early New York session by 1.18% to hover around $69.36 per barrel.
Gold Spot US Dollar fell 0.85% to hover around $4,129.55 per ounce. The U.S. Dollar Index spot was 0.04% higher at the 100.8960 level.
Meanwhile, Bitcoin (CRYPTO: BTC) was trading 0.30% higher at $63,027.20 per coin over the last 24 hours.
Asian markets closed mostly lower on Tuesday, except India’s Nifty 50 index. Australia’s ASX 200, South Korea’s Kospi, Japan’s Nikkei 225, China’s CSI 300, and Hong Kong’s Hang Seng indices fell. European markets were mixed in early trade.
For most of 2026, gold, silver and Bitcoin have been a painful place to put money.
The reason is not hard to find: a fast-shifting outlook for Federal Reserve policy.
The year opened with hopes for rate cuts. Then the war in Iran sent energy prices surging, revived inflation, and flipped the market’s bet from lower rates to higher ones.
For gold, silver and Bitcoin, assets that pay no yield and rise or fall on the path of interest rates, that shift was brutal.
From their January peaks, the SPDR Gold Shares (NYSE:GLD) has fallen about 26%, the iShares Bitcoin Trust(NASDAQ:IBIT) roughly 37%, and the iShares Silver Trust(NYSE:SLV) close to 50%.
Now, almost in unison, all three are rebounding again, for the very same reason they lost it, only in reverse.
An Oil-Driven Disinflation
The Cleveland Fed’s inflation nowcast now shows negative month-over-month readings for both June and July, with headline consumer prices running at minus 0.06% and minus 0.22%, respectively.
WTI crude has slumped to around $68 a barrel, back to where it traded at the end of February before the war began.
That collapse has a clear source.
Since the United States and Iran agreed in mid-June to halt fighting and reopen the Strait of Hormuz, the chokepoint that had been largely closed since February, Gulf supply has flooded back.
Saudi Aramco just cut the official price of its flagship Arab Light grade to Asia for August by $11 a barrel, swinging it from a $9.50 premium to a $1.50 discount over the regional benchmark, as reported by Bloomberg on Monday.
It was the biggest reduction in at least 26 years and far deeper than the $8 cut analysts had expected.
The Hike Narrative May Lose Its Fuel
On the surface, the hawkish case is still standing.
The U.S. economy is expanding at around 2%, with recent core inflation prints in the 3%-4% annualized range, which, on its own, argues for tighter policy.
“The question for hikes seems to be one of when, not if,” said Enrique Díaz-Alvarez, chief economist at Ebury.
Underneath, the data has moved the other way.
The U.S. economy added just 57,000 nonfarm payrolls in June, well short of the roughly 110,000 economists expected, with prior months revised lower.
Traders moved quickly. Odds of a September rate hike, tracked via CME FedWatch, slid from around 66% to near 53%, and the policy-sensitive 2-year Treasury yield eased toward 4.13%.
At the European Central Bank’s Sintra forum, Fed Chair Kevin Warsh said inflation expectations “have come down in recent weeks,” reinforcing the softer tone.
The New York Fed’s May survey put one-year inflation expectations at 3.5%, versus 3.1% three years out, a gap that Ed Yardeni reads as a sign that households see today’s price pressure as temporary rather than structural.
Futures markets had been pricing a rising chance of hikes into year-end, with a nearly one-in-five probability of a target range as high as 4.00% to 4.25% by December.
That pricing is now eroding.
Why Gold, Silver And Bitcoin Are The Unwind Trade
22V Research’s strategist Jordi Visser laid out the mechanics.
“If the Fed-hike positioning unwinds, it’s good for gold, silver, and Bitcoin,” Visser said.
The logic runs through positioning. When the market prices in high rates, the opportunity cost of holding a non-yielding asset rises, and Treasurys look more appealing.
When those rate-hike odds unwind, the calculation reverses just as fast. A dovish repricing hands back exactly what a hawkish one took away.
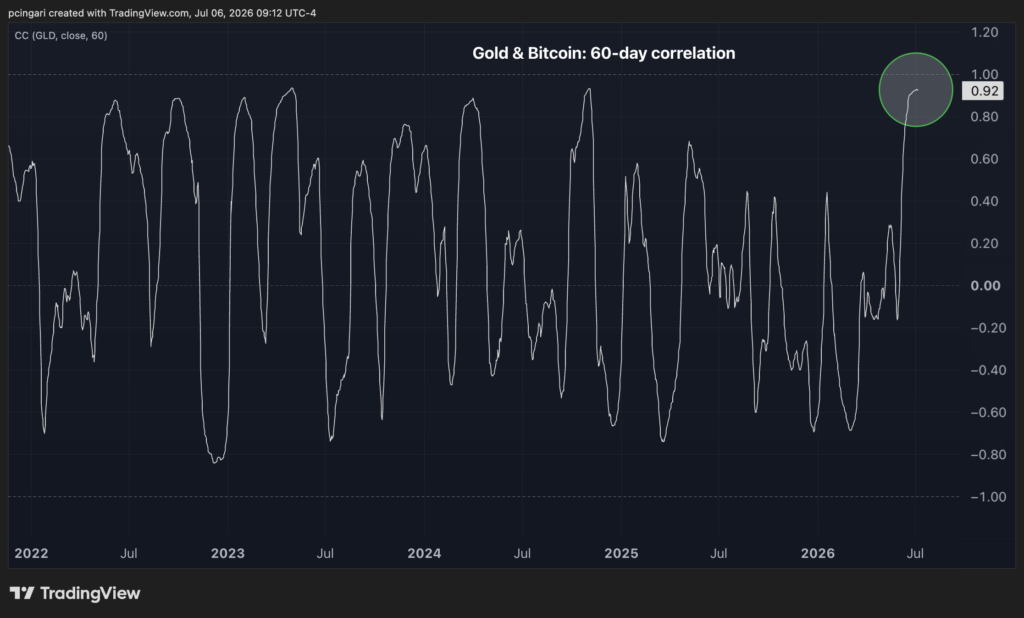
Gold and Bitcoin are now moving almost in lockstep, their 60-day correlation at 0.92, a sign the two are trading as a single macro expression of the same rate view.
What’s Next?
The relief rally in Bitcoin, gold and silver rests on one assumption: that the disinflation is real and durable. It may not be.
The drop is almost entirely energy. Core inflation, which strips out food and fuel, remains firm, with the Fed’s preferred core PCE gauge last at 3.4%, and average hourly earnings still running around 3.5% year-over-year.
That keeps Warsh’s inflation-first Fed in a policy box. The decisive data point is the June CPI report due July 14.
For now, the takeaway is simple: the trade that punished gold, silver and Bitcoin all year has begun to reverse, and its staying power hinges on upcoming data.
Air Products & Chemicals Inc.(NYSE:APD) stock surged more than 9% on Tuesday after the company scrapped several clean-energy projects and shifted its focus toward higher-return investments.
Investors appeared to welcome the move, viewing the project cancellations as a step toward stronger capital discipline and improved long-term returns.
Air Products Scraps Louisiana Clean Energy Project
Air Products said Tuesday it will not proceed with its Louisiana Clean Energy Complex after determining the project no longer met its return criteria.
The decision will result in pre-tax charges of up to $2.9 billion, or about $2.2 billion after tax, in the company’s fiscal third quarter of 2026, primarily for asset write-downs and contract terminations.
The company will also discontinue a zero-carbon liquid hydrogen facility in Casa Grande, Arizona, and several smaller clean-energy distribution projects, citing weak commercial conditions, project-specific economic challenges and slower-than-expected growth in hydrogen-for-mobility markets.
Separately, Air Products said it is finalizing a marketing and distribution agreement with Yara International ASA for renewable ammonia from the NEOM Green Hydrogen Project in Saudi Arabia. The company said the agreement is independent of the Louisiana project decision.
Technical Analysis
Tuesday’s rally pushed Air Products further above its key moving averages. The stock traded about 5.8% above its 20-day simple moving average of $280.95 and roughly 8.6% above its 200-day SMA of $273.66, reinforcing the longer-term uptrend.
Momentum also improved. The moving average convergence/divergence indicator remained above its signal line with a positive histogram, suggesting buying pressure continues to strengthen.
However, the 20-day SMA remains below the 50-day SMA, indicating short-term momentum has not fully confirmed the breakout.
The next resistance level sits near $307.50, just below the 52-week high of $307.96. Initial support is around $274.50, close to the 200-day moving average.
Earnings And Analyst Outlook
Air Products is expected to report fiscal third-quarter results on or around July 30.
Wall Street expects earnings of $3.34 per share, up from $3.09 a year earlier, on revenue of $3.19 billion, compared with $3.02 billion in the prior-year quarter.
The stock trades at about 28.6 times forward earnings, reflecting a premium valuation. Analysts maintain a consensus Buy rating with an average price forecast of $321.44. Recent analyst actions include:
Morgan Stanley maintained an Equal-Weight rating and raised its price forecast to $310 on May 5.
RBC Capital maintained an Outperform rating and raised its price forecast to $341 on May 5.
UBS maintained a Neutral rating and raised its price forecast to $316 on May 1.
Top ETF Exposure
State Street Materials Select Sector SPDR ETF (NYSE:XLB): 4.69% Weight
The Materials Select Sector SPDR Fund (NYSE:XLB): 4.66% Weight
Significance: Because APD carries significant weight in these funds, any significant inflows or outflows for these ETFs will likely force automatic buying or selling of the stock.
Air Products Price Action
APD Stock Price Activity: Air Products shares were up 9.33% at $296.68 at the time of publication on Tuesday, according to Benzinga Pro data.
Tech startup I-Pulse has secured a $250 million research and development grant from the U.S. Department of Commerce’s CHIPS office. It is one of the largest federal investments in a company developing semiconductor technologies.
The funding should accelerate the development of I-Pulse’s proprietary silicon-carbide semiconductor components, strengthening U.S. efforts to boost domestic chip manufacturing and reduce dependence on foreign supply chains.
“This award supports the development of world-leading critical components in the pulsed power technology stack, with profound implications for energy security and national defense,” I-Pulse co-founder and CEO Robert Friedlandsaid in an announcement.
According to Bloomberg, the deal is the latest sign of billionaire mining entrepreneur Robert Friedland’s growing collaboration with the Trump administration on efforts to strengthen U.S. critical mineral and supply-chain security.
Bloomberg noted that Friedland’s Ivanhoe Electric Inc. (AMEX:IE) is also working with the U.S. Export-Import Bank on financing for an Arizona copper project, and that he attended the White House unveiling of a critical minerals stockpiling initiative in February.
Unlocking Clean Energy
The Albuquerque-based firm, located near Sandia National Laboratories and the U.S. Air Force Research Laboratory, will partner with national laboratories, universities, and specialized manufacturers to develop high-temperature, high-current silicon-carbide semiconductor switches.
The firm’s technology uses high-voltage solid-state switches to deliver electrical pulses into rock formations. These pulses then fracture and soften the rock ahead of mechanical drilling, dramatically speeding up the process, increasing the drill bit life, and lowering the drilling costs.
With this technology, I-Pulse aims to unlock large-scale geothermal resources. Geothermal power would provide continuous 24-hour electricity, a growing priority for artificial intelligence infrastructure.
“The limiting factor in artificial intelligence is clean energy, and you can’t do AI with solar or wind. The best answer is geothermal,” Friedland said.
The Underlying Connection
Beyond geothermal energy, the same semiconductor platform has applications in underground mining, tunneling, rock crushing, manufacturing, and defense systems, broadening the technology’s commercial opportunities.
The company has attracted backing from several of the world’s largest mining companies, including BHP Group Limited(NYSE:BHP), Rio Tinto Plc(NYSE:RIO), Newmont Corp.(NYSE:NEM), and Teck Resources Limited(NYSE:TECK). Chile’s state-owned copper producer Codelco also invested about $50 million.
Copper, a commodity which Friedland, a mining veteran, deems crucial, is the connecting point between global interest in this technology. Despite commodity turbulence in the first half of 2026, Global X Copper Miners ETF (NYSE:COPX) is up 4.68% year-to-date.
Declining ore grades mean miners must process significantly more rock to produce the same amount of copper, increasing energy consumption and operating costs. I-Pulse’s technology aims to replace conventional crushing and grinding with electrical rock fracturing, reducing emissions, lowering costs, and improving metal recovery.
“We’re consuming 30 million tons of copper per year, only 4 million tons of which is recycled. That means, to maintain 3% GDP growth, with no electrification, we have to mine the same amount of copper in the next 18 years as we mined in the last 10,000 years,” Friedland said at a recent conference.
“You people have no idea whatsoever what we’re facing. You’re dreaming. Since 1900, the energy to produce copper, the energy you need to make copper is 16-fold up,” he noted, warning about the large disconnect between economic growth, energy expenditure, and affordable mining.
Gold’s spectacular rally, which made it one of the best-performing assets in 2025, has been undergoing an equally dramatic correction. Prices have tumbled around 29% from January’s record high of around $5,600 an ounce to below $4,000.
The most popular ETF benchmark, SPDR Gold Trust(NYSE:GLD), has gone deeply into the red, down 8.12% year-to-date.
The main catalyst has been an inflationary energy shock from the U.S.-Iran war. Inflation concerns forced a prompt revision of lower-interest-rate expectations that had driven the precious metals bull market of 2025. Instead, investors encountered tightening monetary policy and rapidly shifting sentiment.
Under the new Fed Chair, Kevin Warsh, policymakers have pivoted away from rate cuts and toward fighting energy inflation. According to the CME FedWatch, markets now imply roughly a 70% probability of a rate increase by September and a near-certainty of another move by December.
The implications for a non-yielding asset like gold are straightforward. Opportunity costs rise, while a stronger U.S. dollar delivers a double whammy. Both dynamics have pressured bullion prices and encouraged investors to reduce exposure through exchange-traded funds.
“The shift away from inflationary cuts toward tighter policy is a headwind for gold,” Bank of America analysts wrote in the latest note.
The bank is among the institutions revising the near-term outlook. Its previous forecast was $6,000 an ounce by next spring – a target that now appears unlikely under current monetary conditions. Analysts argue that gold must first “price out” the expected rate hikes before investment demand can recover.
Deutsche Bank has likewise turned more cautious. According to Bloomberg, the bank cut its third-quarter gold forecast by 22% to $4,300 an ounce, though that still sits above the current spot price of around $4,000.
“Fed repricing, together with resilient U.S. macro data, has played the primary role in pushing gold lower,” analyst Michael Hsueh wrote in the Tuesday note.
The bank expects a rebound toward $4,800 in the fourth quarter if the Fed pauses after its initial tightening moves. However, if three or four hikes materialize, the bank says it could drive the price to $3,800 an ounce.
A Hidden Opportunity
Yet beneath the short-term pessimism, metal’s long-term outlook remains constructive. Central bank demand continues to provide a critical foundation for prices.
A recent survey showed that nearly three-quarters of reserve managers expect moderate or significant reductions in U.S. dollar holdings over the next five years, reinforcing the broader de-dollarization trend that has been driving official-sector purchases.
The opportunity may be even more pronounced in mining equities. Bank of America’s price-to-net-asset-value analysis suggests gold producers are valuing bullion at an average implied price of just $3,354 an ounce, roughly 19% below prevailing spot levels.
However, investors must take an extraordinary price dispersion into account. Wheaton Precious Metals Corp. (NYSE:WPM) carries the highest implied gold price at $4,395 an ounce, while Franco-Nevada Corp.(NYSE:FNV) reflects a far more conservative $2,416.
The sponsor of the ERShares Private-Public Crossover ETF(NASDAQ:XOVR) on Monday outlined how the fund navigated the highly hyped IPO of Space Exploration Technologies Corp (NASDAQ:SPCX), or SpaceX, positioning the event as a case study for its private-public crossover investing strategy.
ERShares said XOVR was designed to give investors exposure to high-growth private companies before they reach public markets, applying what it calls a “VC Lens” across both public and private investments.
The firm argued that the SpaceX listing underscored a broader trend of category-leading companies remaining private longer and creating significant value before becoming widely accessible to public investors.
Key Developments
ERShares said the period surrounding SpaceX’s IPO served as a real-world demonstration of how its private-public crossover ETF strategy works.
The firm noted that many fast-growing companies are staying private longer, creating substantial value before public investors can access them. Through the XOVR, the asset manager seeks to bridge that gap by combining public equities with selective exposure to the private market.
The fund’s approach was shaped by lessons learned earlier this year when a surge of investor interest tied to SpaceX caused XOVR’s assets to jump from approximately $400 million to $1.8 billion.
As new money poured into the ETF, the fund’s SpaceX allocation was diluted from roughly 10% to less than 2%. In response, ERShares launched what it called a “Transparency Reset,” converting the fund’s SpaceX holdings into a 0/0 special purpose vehicle structure that carries no management or performance fees at the SPV level.
Ahead of the SpaceX IPO, ERShares also implemented a first-of-its-kind liquidity arrangement that allowed the ETF to increase its SpaceX exposure while remaining compliant with ETF regulations. According to the firm, these changes helped maintain a SpaceX weighting of about 13% to 14% even as XOVR’s assets expanded to roughly $2.4 billion.
To prevent another round of dilution, ERShares introduced a Shareholder Protection Plan before the IPO. The firm estimates that the plan blocked more than $1 billion of short-term, event-driven inflows from investors seeking temporary exposure to SpaceX through XOVR. The measures included creation controls, transaction-fee mechanisms and valuation procedures designed to preserve the benefits of the IPO for long-term shareholders.
ERShares said the strategy paid off, with XOVR’s SpaceX position generating more than $183 million in unrealized appreciation and contributing to a 30.71% gain in the ETF between March 30 and June 15.
The company said the experience demonstrated how a venture-capital-style investment approach can be applied within an ETF structure to capture opportunities across both private and public markets.