The S&P 500 index has started September on a sour note, dropping 2.8% in the first 10 days of the month.
This marks the fifth-worst start for September in the last 25 years, trailing only 2020 (-5.31%), 2011 (-4.15%), 2008 (-3.34%), and 2001 (-2.97%).
While the initial month weakness is already notable, historical seasonality suggests that the worst may still be ahead.
A Historically Weak Start
Historically, September is one of the worst-performing months for the S&P 500, and the early days of the month typically set the tone for the rest of the month.
A Benzinga analysis, powered by the AI tool “seasonality.ai,” reveals that over the past 25 years, the SPDR S&P 500 ETF Trust (NYSE:SPY) has posted negative returns in the first 10 days of September on 14 occasions, with a slightly negative average return (-0.14%).
Yet, not all September starts are doom and gloom, though. In 2009, for example, the index rallied 4.58% in the first 10 days, representing the best start in the dataset.
The worst starts occurred in 2020, when the S&P 500 plummeted 5.31% in the 10 opening days of the month, followed by 2011 (-4.15%) and 2008 (-3.34%).
SPDR S&P 500 ETF Trust
From Sept. 1 to Sept. 10 (Last 25 Years)
Avg. Return
-0.14%
% Gain Hit Ratio
40%
% Max Return
4.58%
% Max Year
2009
% Min Return
-5.31%
% Min Year
2020
Data: Seasonality.ai
First 10 Days Of September: S&P 500 Performance (2000-2024)
Year
Performance (%)
2000
-1.69
2001
-2.97
2002
3.87
2003
-0.82
2004
1.56
2005
1.72
2006
-0.87
2007
-2.21
2008
-3.34
2009
4.58
2010
2.78
2011
-4.15
2012
1.76
2013
2.73
2014
-0.27
2015
2.13
2016
-1.89
2017
-0.51
2018
-0.59
2019
2.54
2020
-5.31
2021
-1.41
2022
2.57
2023
-1.26
2024
-2.82
Data: Seasonality.ai
Last 20 Days Of September: Even More Pain?
Unfortunately, the seasonality picture only deteriorates as the month progresses. Historical data shows that from Sept. 11 through Sept. 30, the S&P 500 tends to suffer even more.
Over the past 25 years, the index has declined an average of 1.69% during these remaining 20 days, suggesting that the second half of the month often compounds early losses.
The back end of September has been negative 16 times in the last 25 years—more than two-thirds of the time. Some years have seen catastrophic declines during this period.
In 2022, the S&P 500 plunged by 13.09% during the last 20 days of September, marking its worst late-September performance in recent history.
This sharp decline was largely driven by investor anxiety following the September 2022 FOMC meeting, where the Federal Reserve delivered its third consecutive 75-basis-point rate hike, pushing the federal funds rate to a range of 3.00% to 3.25%. The aggressive tightening was aimed at combating inflation, which was hovering at around 8-9% at the time.
On the day of the rate decision, the S&P 500 dropped 1.7% as Fed Chair Jerome Powell signaled that the central bank would continue raising rates “until the job is done,” heightening fears of a prolonged tightening cycle and its potential impact on the economy.
Other severe drops include 2002, when the index lost 10.25%, and 2008, with a 7.59% fall.
The trend of weak late-September performance isn’t limited to bear markets. Even in traditional bullish years, the S&P 500 often stumbles. In 2023, the index lost 4.68% in the last 20 days of the month, while 2019 saw a 1.2% decline.
However, not every bullish year is negative—2007 and 2006 both saw gains of 3.45% and 2.43%, respectively, but these instances represent the exception rather than the rule.
SPDR S&P 500 ETF Trust
From Sept. 11 to Sept. 30 (Last 25 Years)
Avg. Return
-0.69%
% Gain Hit Ratio
33%
% Max Return
3.45%
% Max Year
2007
% Min Return
-13.1%
% Min Year
2022
Data: Seasonality.ai
Last 20 Days Of September: S&P 500 Performance (1999-2023)
Nvidia Corp. (NASDAQ:NVDA) is set to report its highly anticipated earnings Wednesday, and the stakes couldn’t be higher.
As the undisputed leader in the AI revolution, Nvidia’s results will be a critical indicator for the broader market, particularly for those invested in semiconductor and technology sectors.
This highly followed market event offers both risk and opportunity. For traders seeking to capitalize on Nvidia’s earnings without the direct exposure to single-stock volatility, ETFs with substantial Nvidia holdings present an appealing alternative.
Wall Street has set an ambitious target for Nvidia this quarter, with revenue expected to hit $28.74 billion — a staggering 17% increase from the previous quarter and an eye-popping 156% jump from the same quarter last year.
Earnings per share (EPS) are forecasted to rise to 65 cents, up from 56 cents in the prior quarter and 21 cents in the same period last year.
Goldman Sachs’ semiconductor analyst, Toshiya Hari, is bullish on Nvidia’s prospects, predicting the company will surpass these already lofty expectations.
“We believe customer demand across the large Cloud Service Providers and enterprises is strong, and Nvidia’s robust competitive position in AI/accelerated computing remains intact,” Hari stated in a note published this month.
The driving force behind this optimism? Data Center revenues and strong operating leverage. Hari highlights three key areas: robust demand for the H100 GPUs, the launch of volume shipments of the H200, and the ramp-up of Nvidia’s Ethernet-based networking product, Spectrum-X. These factors could fuel a significant earnings beat, potentially leading to upward revisions in EPS.
Shares of the AI tech giant are up 159% year to date, after surging by 239% in 2023.
Historical Volatility: A Look At Past Nvidia Earnings
Nvidia’s stock has a history of sharp rallies post-earnings, with an average one-day boost of 9% over the past eight quarters and 7.1% over the last four.
A Goldman Sachs analysis identified the VanEck Semiconductor ETF (NASDAQ:SMH) as having the highest average post-earnings move (3.4%) following Nvidia’s past eight earnings releases.
It was followed by the iShares Semiconductor ETF (NYSE:SOXX) at 2.9% and the ARK Innovation ETF (NYSE:ARKK) at 2.4%.
Top 10 ETFs With Nvidia Exposure
For traders looking to gain exposure to Nvidia’s potential earnings-driven rally, here are 10 ETFs with the largest holdings in the stock:
As the price of gold recently surpassed $2,500 per troy ounce, the value of a standard 400-troy-ounce gold bar has skyrocketed to the $1-million milestone for the first time in history.
This surge isn’t due to a flood of consumers rushing to buy jewelry or a sudden spike in investor demand for this traditional safe haven. Instead, the rally is largely fueled by expectations surrounding the Federal Reserve’s monetary policy.
Why Have Gold Prices Rallied This Summer?
Gold spiked 2.7% month-to-date as of Aug. 20, following a robust 5.2% gain in July. The driver? Growing anticipation that the Federal Reserve will soon begin cutting interest rates.
Investors are particularly focused on the upcoming Jackson Hole Symposium, set for Aug. 22-24. This event is seen as critical for gaining insight into the Fed’s future policy direction.
Currently, Fed futures suggest a 73.5% chance of a 25-basis-point rate cut in September. Markets are also pricing in a cumulative 82 basis points in cuts by the end of the year, pointing to at least two more rate reductions in November and December.
These expectations have bolstered the bullish sentiment around gold. Lower interest rates generally make non-yielding assets like gold more attractive, as they diminish the allure of yield-bearing alternatives.
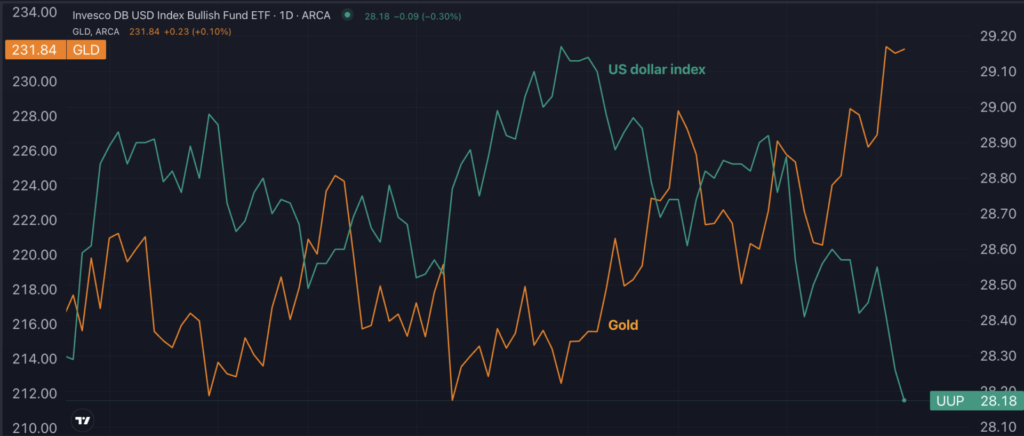
Adding to the momentum, the U.S. dollar has weakened sharply, hitting new 2024 lows against a basket of major currencies. As the dollar depreciates, gold—priced in dollars—becomes more affordable for foreign investors, further driving demand.
The chart below illustrates the inverse relationship between the U.S. Dollar Index, represented by the green line and tracked by the Invesco DB USD Index Bullish Fund ETF (NYSE:UUP), and gold prices, depicted by the yellow line and tracked by the SPDR Gold Trust (NYSE:GLD).
Year-to-date, gold has surged 22%, setting the stage for its best annual performance since 2020, when it gained 25%. If the current trend holds, 2024 could mark gold’s second-best year since 2008, when it rocketed up by 29.6%.
While most gold bar transactions happen through authorized dealers, it’s becoming easier for individual investors to enter the market. Retail giants like Costco Wholesale Corp. (NASDAQ:COST), Amazon.com Inc. (NASDAQ:AMZN), and WalmartInc. are also selling the bullion, providing a more accessible entry point for consumers.
What Can a 400-Troy-Ounce Gold Bar Buy You?
With a 400-troy-ounce gold bar now worth about $1 million, here’s what you could trade it for:
239,258 pounds of copper
17 Bitcoins according to the latest Bitcoin (CRYPTO: BTC) price of $58,730
Macro-related volatility could surge across markets as investors evaluate the policy risks associated with the upcoming U.S. presidential elections and the increasing likelihood of a Donald Trump victory.
Alfonso Peccatiello, an Italian economist based in Amsterdam and known as @macroalf on X, issued this warning in an email to his Macro Compass clients on Monday.
“The S&P 500 realized volatility is below 10%. Credit spreads are super tight, and aside from some short-lived European political drama, markets keep marching higher,” Peccatiello said, explaining the relative state of calm of today’s market landscape.
On Monday, the SPDR S&P 500 ETF Trust (NYSE:SPY), which tracks the 500 largest U.S. corporations, traded near the record high of 5,655 set last Friday. Meanwhile, the CBOE Volatility Index (VIX), known as the market fear index, remained below 13, indicating very low volatility levels compared to its recent history.
However, Peccatiello warned that “macro volatility is coming back,” highlighting several reasons why investors should prepare for a turbulent market environment in the upcoming months.
Suppressed economic cycles lead to system fragility
Peccatiello assumes that suppressing economic cycles with an “artificial equilibrium” from fiscal and monetary policies will make the financial system more fragile in the long run.
He said, “We are not allowed to have a recession anymore,” stressing that prolonged periods without recessions could lead to significant systemic risks.
Peccatiello used a chart by Prof. Lee Coppock, showing the number of months the US economy spent in recession over 30-year periods since the 1870s:
1870-1899: 179 months
1900-1929: 152 months
1930-1959: 88 months
1960-1989: 59 months
1990-2023: 36 months
Peccatiello explained that while reduced time in recessionary conditions suggests economic stability, it also indicates the suppression of natural economic cycles, leading to more macro-related volatility.
This graphic surprises me every time I update! One more reminder that things aren’t generally as bad as they once were. pic.twitter.com/MRNUnvKsez
Geopolitical Stability: Reduced systemic wars contribute to financial and economic stability.
Shift from Gold Standard to Fiat Money: The transition from a Gold Standard to a fully elastic Fiat Money system allows for rapid expansion of fiat money creation, reducing economic volatility.
Policymaker Intervention: Policymakers’ efforts to avoid recessions have led to a suppression of natural economic cycles, potentially resulting in decreased productivity and increased economic instability.
Peccatiello highlighted the differences between the current economic environment and the pre-2008 era. The 2005-2007 period saw excessive private sector borrowing, leading to a credit-driven money expansion and the eventual housing market collapse.
In contrast, today’s money creation is primarily driven by large government deficits.
US Elections To Lead To Higher Macro Volatility
Peccatiello identified the upcoming U.S. presidential election as a significant source of potential macro volatility. Following the presidential debate, the bond market has shown signs of increased volatility, with the Treasury yield curve steepening significantly, as longer-dated yields grew more than shorter-dated ones.
The market’s response reflects concerns about Donald Trump‘s potential economic policies, which include:
Tough stance on immigration: Likely to increase inflationary and wage pressures.
Heavy tariffs on China: Expected to raise import prices and reduce global trade volumes.
Pressure on the Fed to cut rates: Risk of overheating the economy and generating further inflationary pressures.
As Trump’s odds of winning the election rise, so do the risks of inflationary or stagflationary policies, leading bond market investors to seek higher term premiums, according to the expert.
Market-prediction odds indicate that the chances of Trump winning the election have surged to over 70% following the assassination attempt in Butler, Pennsylvania.
Peccatiello cautions that “if volatility comes back in bond markets, you better watch out,” suggesting that we may currently be experiencing the proverbial calm before the storm.
The U.S. economy sharply disappointed economist growth estimates last quarter, yet it surpassed price pressure predictions, indicating that inflation is weighing on real economic activity — a scenario typically referred to as stagflation.
The gross domestic product (GDP) advanced at a 1.6% annualized rate in the first quarter of the year, significantly slowing down compared to both the 3.4% growth in Q4 2023 and the 2.5% expected.
It also marks the lowest expansion since the contraction in Q2 2022. Simultaneously, price pressures — as indicated by the Personal Consumption Expenditure (PCE) price index — rose during the quarter.
The headline PCE price index recorded a 3.4% quarter-on-quarter annualized increase, up from 1.8% earlier, while the core PCE price index — the Fed’s preferred inflation gauge —soared from 2% to 3.7%, above the expected 3.4%.
Economists and market experts weigh in on the numbers released Thursday by the Bureau of Economic Analysis.
Experts Signal Rising Stagflationary Risks For The US Economy
“For those who do not understand what just happened, we have a weakening economy with rising inflation: The worst possible outcome for the Fed,” the Kobeissi Letter wrote on social media X.
Mohamed El-Erian, chief economic adviser at Allianz, emphasizes that any hope pinned on the recent US GDP data to alleviate pressure on US government bond yields will be completely disappointed due to another significant inflation reading.
This dual challenge of sluggish growth coupled with elevated inflation “is problematic for the economy and markets, with political and social spillovers,” the economist added.
Echoing this message, macroeconomist Craig Shapiro remarked “Weaker than expected GDP and Personal Consumption but higher than expected Core PCE Index and better labor data. That’s a stagflationary mess for folks begging for the Fed put to be activated.”
“This report was the worst of both worlds: economic growth is slowing and inflationary pressures are persisting,” claimed Chris Zaccarelli, chief investment officer for Independent Advisor Alliance
Zaccarelli commented on the Federal Reserve’s desire for inflation to begin decreasing persistently, whereas the market is keen on witnessing growth in economic activity and corporate profits.
Consequently, if neither of these trends aligns with expectations, “that’s going to be bad news for markets.”
PCE figures are under scrutiny as slowing inflation remains the primary concern for the Federal Reserve. The debate over whether to cut or increase interest rates has intensified, contributing significantly to the recent uncertainty in bond and stock markets, according to Zaccarelli.
Ted Zhang, associate portfolio manager at Revere Asset Management, observed yields surging amid soft GDP growth and increased PCE prices, with commodities also displaying strength, reminiscent of the stagflation era of the 1970s.
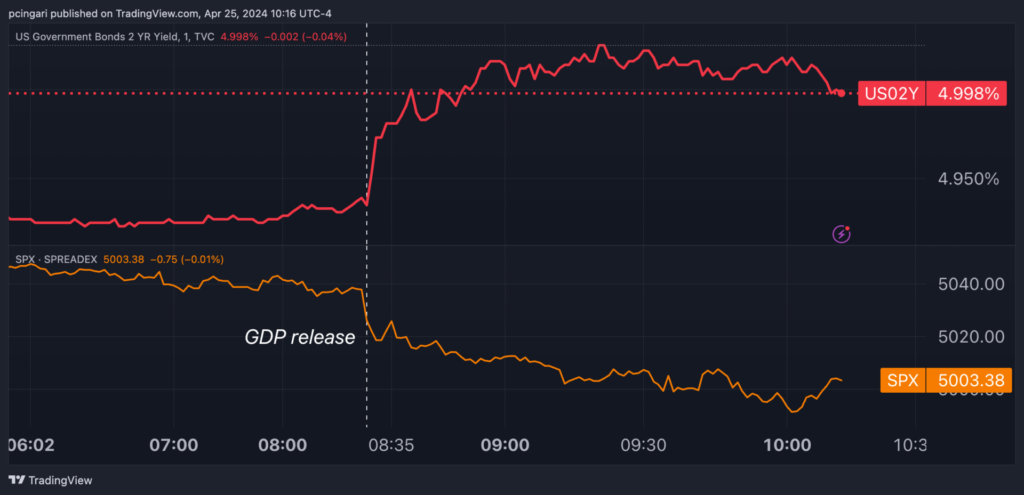
Yields on two-year Treasury notes surpassed the 5% mark, while those on the 30-year benchmark rose to 4.83%. Markets negatively reacted, with both bonds and stocks displaying heavy losses.
The iShares 20+ Year Treasury Bond ETF (NASDAQ:TLT) fell 1%, hitting mid-November 2023 lows, while the S&P 500, as tracked by the SPDR S&P 500 ETF Trust (NYSE:SPY) fell 1.4%.
Chart: Treasury Yields Rise, Stocks Fall Following Q1 Stagflationary Headwinds
Ernie Tedeschi, director of economics at The_Budget_Lab and former chief economist at the White House Council of Economic Advisers, offered a distinct perspective.
The expert highlighted that the GDP miss was primarily due to weaknesses in volatile components, particularly net exports.
On the other hand, private domestic final purchases, representing “core GDP” consisting of consumption and fixed investment, recorded a “very strong” growth of 3.1%.
The concerning aspect of this report isn’t new: quarterly inflation has accelerated. While Tedeschi believes Q1 might overstate the remaining excess inflation—suggesting a trend closer to 2 1/2-3%—it still triggers anxiety.
Real GDP growth came in at 1.6% in Q1, softer than expected. But that appears to be driven by weakness in volatile components, especially net exports. Private domestic final purchases–”core GDP” made up of consumption & fixed investment–grew 3.1%, a very strong print. pic.twitter.com/2hidy6gmb2
Recent spikes in commodity prices are tipping the balance towards a potentially grim economic outlook for the year, akin to the challenging times seen in the 1970s.
Ed Yardeni, the president and CEO of Yardeni Research, notes that the chances of witnessing a repeat of the 1970s are increasing, with risks of oil prices hitting $100 per barrel and gold soaring to $3,000 an ounce.
“We are still assigning subjective probabilities of 60% to the Roaring 2020s, 20% to a bout of irrational exuberance, and 20% to a second peak in inflation as occurred during the 1970s,” Yardeni outlined in a recent post.
However, he warned that the odds of a 1970s-like scenario could increase further if the price of oil continues to rise.
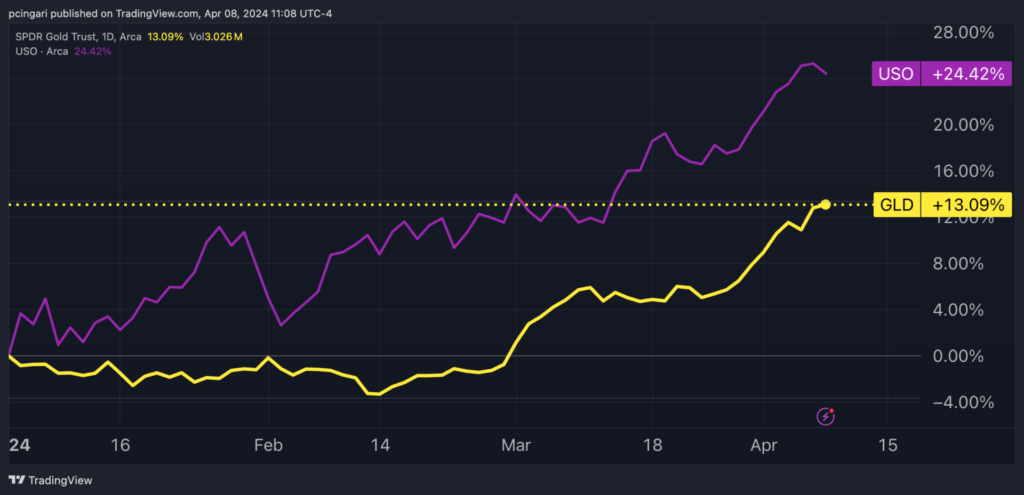
The West Texas Intermediate (WTI) light crude, as tracked by the United States Oil Fund (NYSE:USO) has already rallied 24% year-to-date. Gold prices, as monitored through the SPDR Gold Trust (NYSE:GLD) have risen by 13% year-to-date, and by 27% since October’s 2023 lows, breaking new record highs.
Chart: Oil Prices, Gold On A Launchpad?
The Impact Of Geopolitics On Oil Prices
Yardeni stated that “a direct confrontation between Israel and Iran would rapidly boost the price of a barrel of Brent crude oil over $100.”
An intriguing angle raised by Yardeni has to do with the interplay between oil prices and U.S. presidential elections.
Yardeni, citing geopolitical expert Stephen Soukup, suggests Saudi Arabia might try influencing the U.S. election by raising oil prices. He states, “the basic thesis is that the Saudis might like to see President Biden lose to Donald Trump. So they might do whatever they can to boost the price of oil before the November election.”
Liz Peek, a former Wall Street oil-field analyst and current political-economic commentator, also speculated in her column for The Hill that the Saudi government might be trying to impact President Joe Biden‘s reelection campaign by keeping oil prices elevated.
For the Russians, high oil prices are essential for survival, Peek noted. Conversely, the Saudis view soaring oil costs as crucial for realizing the ambitious economic vision of Crown Prince Mohammed bin Salman (MbS) and as a means for “exacting revenge against Biden.”
With the U.S. election looming, the manipulation of oil prices could have a dual impact on Biden’s administration by exacerbating inflation and complicating foreign policy in Russia and Eastern Europe. A recent poll indicated that 22% of voters ranked inflation as their top issue, suggesting that rising fuel costs will likely remain a prominent concern.