If understood and applied correctly, technical analysis is a study of supply and demand and market psychology. Classic chart patterns are graphical illustrations of these dynamics.
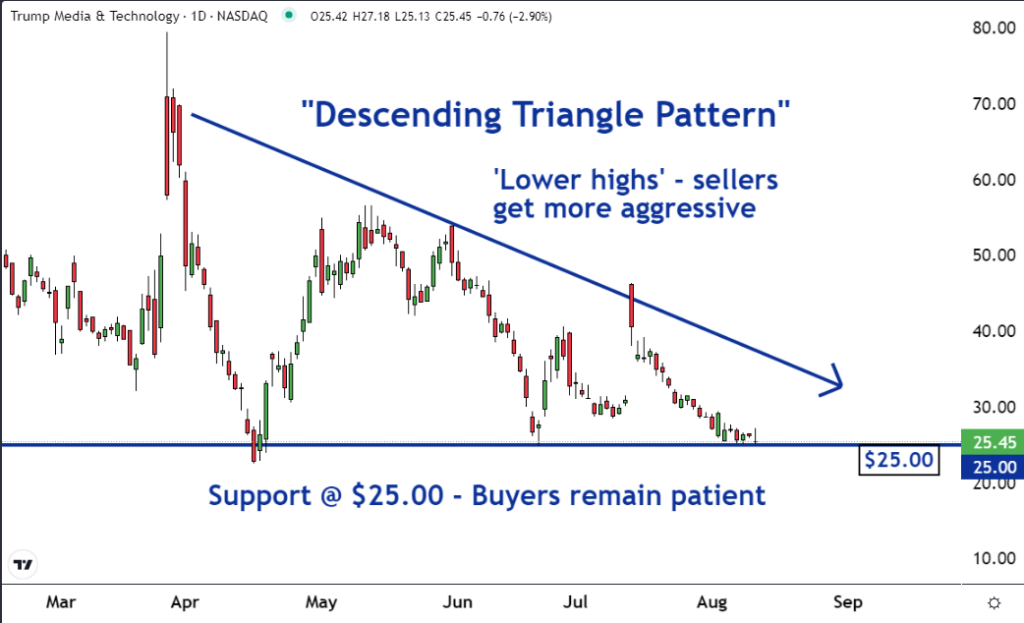
For example, a ‘descending triangle’ has formed on the chart of Trump Media & Technology Group Corp. (NASDAQ:DJT). This pattern typically has bearish implications and suggests that the price is about to move lower. This is why our team of expert traders and technical analysts have made it our ‘Stock of the Day’.
A descending triangle shows that as time passes, buyers remain patient while sellers become increasingly aggressive. Regardless of the market, aggressive sellers and complacent or patient buyers can set the stage for a move South.
As you can see on the chart, the $25 level has been support for DJT since April. Each time the shares dropped to this price, buyers put a floor under it. This means that these buyers were willing to be patient and let the sellers come to them.
The horizontal support line is an illustration of patient or complacent buyers.
As you can also see on the chart, the resistance line has been declining or descending since late March. This line illustrates a series of ‘lower highs’.
It shows that as time has passed, the sellers have become increasingly aggressive. They have been willing to accept successively lower prices for their shares.
The descending resistance line is an illustration of aggressive sellers
When a stock reaches a support level, as DJT has done, traders and investors become curious as to whether the support will break and the shares will head lower, or if the support will hold and the shares will reverse and rally.
When there is a descending triangle pattern or series of lower highs in a trend before a stock reaches support, there is a good chance that the support breaks. The aggressive sellers will overpower the patient buyers. This will force the price lower.
There is a good chance that shares of DJT are about to enter a new downtrend.
Occidental Petroleum Corp (NYSE:OXY) shares are oversold. They are also at support. And stocks that are oversold and at support tend to rally.
That’s why our team of trading experts has identified it as our Stock of the Day.
Most of the time, a stock stays within its typical or average trading range. But if sellers are extremely aggressive and push the shares below this range, traders say that it is “oversold.”
This is important because it will draw buyers into the market. They will be expecting a reversion back to the average. This means a move higher and their buying could make it happen.
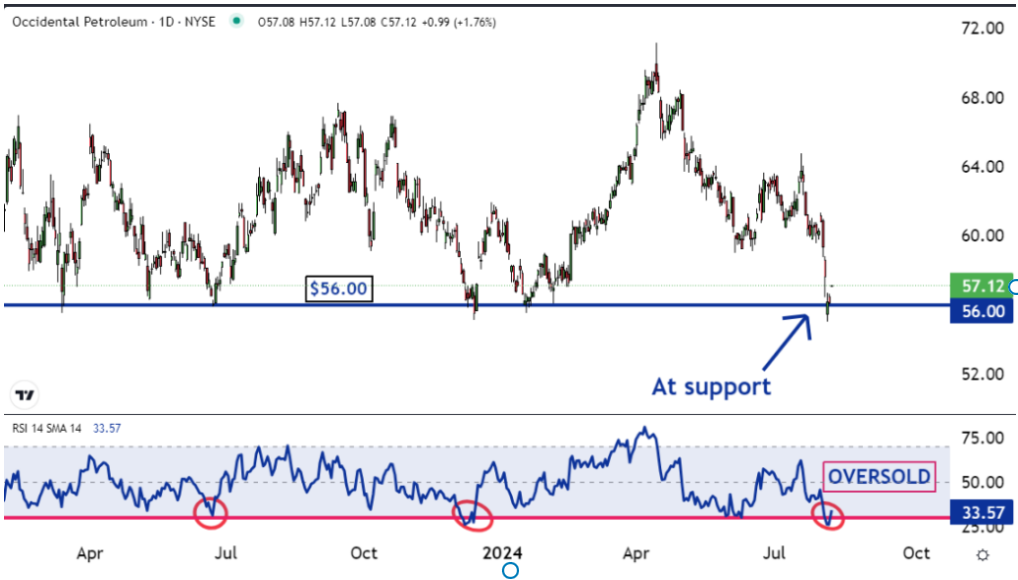
The lower part of the chart is the Relative Strength Index (RSI). When the blue line is below the horizontal red line it indicates oversold conditions.
As you can see that’s the case now. You can also see that the last two times the stock was as oversold as it is now, big moves higher followed.
Support is a large group of traders and investors who are looking to pay the same, or close to the same, price for new shares. For more than a year, there has been support for Occidental around the $56.00 level. As you can also see on the chart, the shares are trading close to this price.
Sometimes shares rally after they reach support. This happens when some of the buyers who created the support begin to worry that they may miss the trade.
They know that the buyers will go to whoever is willing to pay the highest price. They become concerned others will increase their bid prices. As a result, these concerned buyers increase the prices they are willing to pay.
Other concerned buyers see this and do the same thing. This could turn into a bidding war that results in the price moving higher.
This combination of being oversold while simultaneously being at support means there is a good chance shares of Occidental will rally.