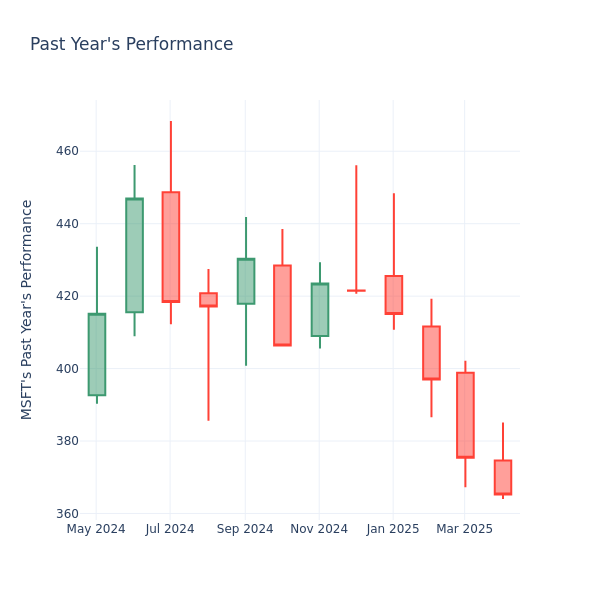
In the current session, Microsoft Inc. (NASDAQ:MSFT) is trading at $365.39, after a 2.07% decrease. Over the past month, the stock decreased by 7.09%, and in the past year, by 13.93%. With performance like this, long-term shareholders are more likely to start looking into the company’s price-to-earnings ratio.
Microsoft P/E Compared to Competitors
The P/E ratio is used by long-term shareholders to assess the company’s market performance against aggregate market data, historical earnings, and the industry at large. A lower P/E could indicate that shareholders do not expect the stock to perform better in the future or it could mean that the company is undervalued.
Compared to the aggregate P/E ratio of the 71.75 in the Software industry, Microsoft Inc. has a lower P/E ratio of 30.07. Shareholders might be inclined to think that the stock might perform worse than it’s industry peers. It’s also possible that the stock is undervalued.
In summary, while the price-to-earnings ratio is a valuable tool for investors to evaluate a company’s market performance, it should be used with caution. A low P/E ratio can be an indication of undervaluation, but it can also suggest weak growth prospects or financial instability. Moreover, the P/E ratio is just one of many metrics that investors should consider when making investment decisions, and it should be evaluated alongside other financial ratios, industry trends, and qualitative factors. By taking a comprehensive approach to analyzing a company’s financial health, investors can make well-informed decisions that are more likely to lead to successful outcomes.
Pulled from Benzinga Pro data the above sector movers alert assists traders in understanding macro-level trends and market variations. Traders will look for sector movers providing information on sectors that are over- or under-performing, deriving these results into investing decisions on exchange-traded funds (ETFs) or individual tickers in those sectors.
For more information on sector movers, click here.
Financial giants have made a conspicuous bullish move on Energy Transfer. Our analysis of options history for Energy Transfer (NYSE:ET) revealed 13 unusual trades.
Delving into the details, we found 46% of traders were bullish, while 46% showed bearish tendencies. Out of all the trades we spotted, 5 were puts, with a value of $673,050, and 8 were calls, valued at $357,375.
What’s The Price Target?
After evaluating the trading volumes and Open Interest, it’s evident that the major market movers are focusing on a price band between $10.0 and $25.0 for Energy Transfer, spanning the last three months.
Analyzing Volume & Open Interest
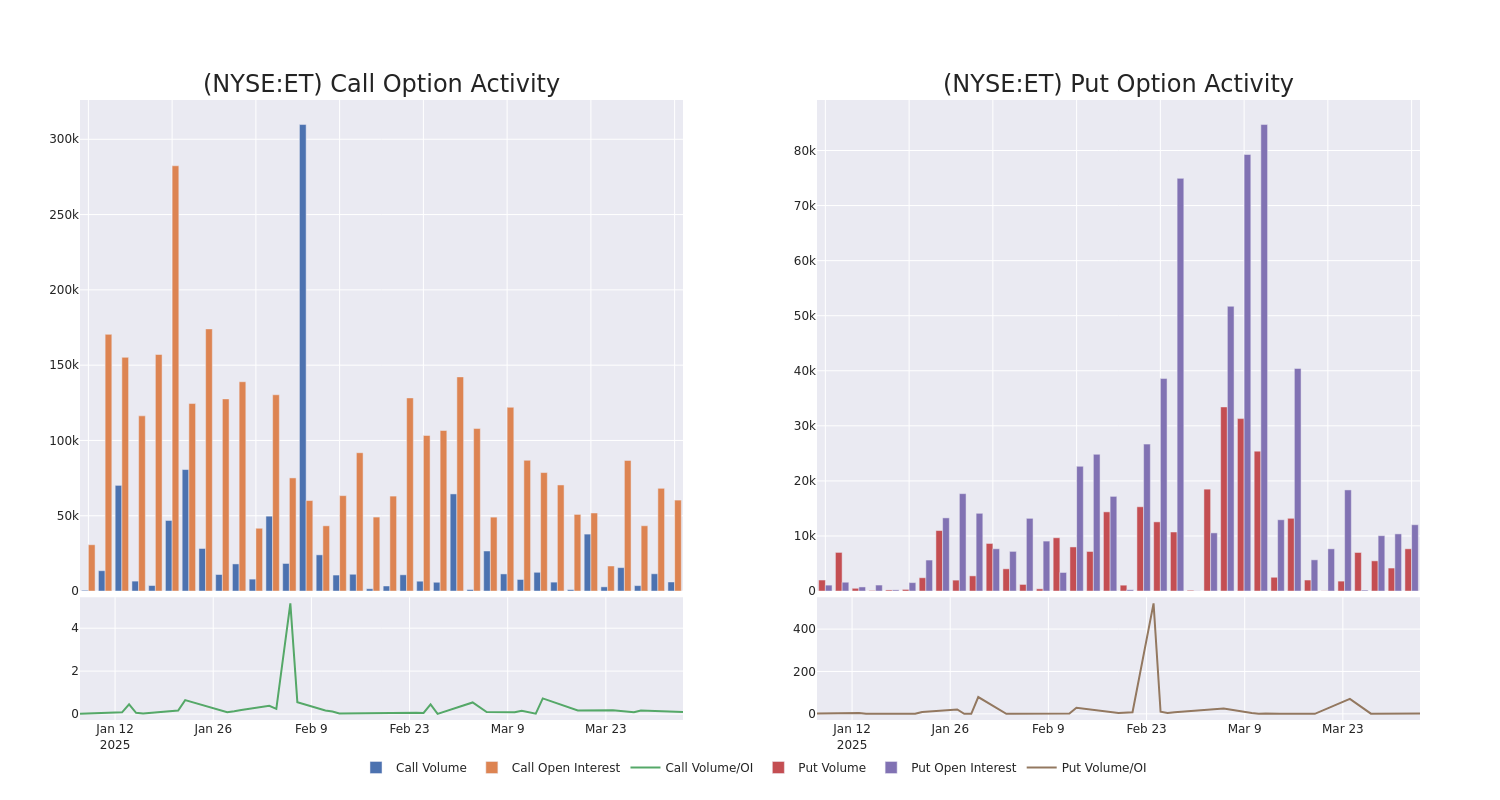
Assessing the volume and open interest is a strategic step in options trading. These metrics shed light on the liquidity and investor interest in Energy Transfer’s options at specified strike prices. The forthcoming data visualizes the fluctuation in volume and open interest for both calls and puts, linked to Energy Transfer’s substantial trades, within a strike price spectrum from $10.0 to $25.0 over the preceding 30 days.
Energy Transfer 30-Day Option Volume & Interest Snapshot
Largest Options Trades Observed:
Symbol
PUT/CALL
Trade Type
Sentiment
Exp. Date
Ask
Bid
Price
Strike Price
Total Trade Price
Open Interest
Volume
ET
PUT
SWEEP
BULLISH
04/11/25
$1.34
$1.17
$1.22
$19.00
$469.7K
5.1K
5.0K
ET
CALL
SWEEP
NEUTRAL
01/16/26
$0.22
$0.16
$0.19
$25.00
$91.5K
29.6K
4.8K
ET
PUT
TRADE
BULLISH
04/11/25
$1.2
$1.17
$1.17
$19.00
$83.0K
5.1K
1.1K
ET
CALL
TRADE
BEARISH
01/15/27
$3.8
$3.7
$3.7
$15.00
$55.5K
16.6K
150
ET
CALL
TRADE
BEARISH
01/15/27
$5.6
$5.1
$5.17
$13.00
$51.7K
1.9K
100
About Energy Transfer
Energy Transfer owns one of the largest portfolios of crude oil, natural gas, and natural gas liquid assets in the US, primarily in Texas and the US midcontinent region. Its pipeline network includes more than 12,000 miles of intrastate pipelines and 20,000 miles of interstate pipelines. It also owns gathering, processing, and storage facilities in the largest US oil and gas producing regions. Other businesses include a network of natrual gas liquids and refined products facilities, 18,000 miles of crude oil pipelines, and the Lake Charles gas liquefaction facility. Energy Transfer combined its publicly traded limited and general partnerships in October 2018.
Having examined the options trading patterns of Energy Transfer, our attention now turns directly to the company. This shift allows us to delve into its present market position and performance
Energy Transfer’s Current Market Status
With a volume of 17,825,699, the price of ET is down -4.94% at $18.0.
RSI indicators hint that the underlying stock is currently neutral between overbought and oversold.
Next earnings are expected to be released in 34 days.
What The Experts Say On Energy Transfer
Over the past month, 2 industry analysts have shared their insights on this stock, proposing an average target price of $24.5.
Unusual Options Activity Detected: Smart Money on the Move
Benzinga Edge’s Unusual Options board spots potential market movers before they happen. See what positions big money is taking on your favorite stocks. Click here for access.
* Maintaining their stance, an analyst from Morgan Stanley continues to hold a Overweight rating for Energy Transfer, targeting a price of $26.
* Reflecting concerns, an analyst from RBC Capital lowers its rating to Outperform with a new price target of $23.
Options trading presents higher risks and potential rewards. Astute traders manage these risks by continually educating themselves, adapting their strategies, monitoring multiple indicators, and keeping a close eye on market movements. Stay informed about the latest Energy Transfer options trades with real-time alerts from Benzinga Pro.
Pulled from Benzinga Pro data this sector movers alert provides traders with a compiled way to read macro-level market trends. Investors garner a particular interest in sector movers to better determine sectors that are over- or under-performing to make better investing decisions on exchange-traded funds (ETFs) or individual tickers in those sectors.
For more information on sector movers, click here.
What Sen wrote is probably a lot more true of Liberation Day than the special elections. President Trump’s announcement of the details of our new tariff regime (Liberation Day) seems like a big deal. Either the details are worse than the market expects, in which case we see another leg down in stocks, or the reverse and we get a big relief rally.
When In Doubt, Bet On Both
Since we don’t know which is going to happen, why not bet on both outcomes? As long as your potential upside on each trade is greater than 100%, you can make money on the combination of both bets in either outcome. Below is an approach you can use. For illustration purposes, we’ll use data as of Tuesday’s close. You may want to check real-time data before placing your trades though.
Pick A Couple Of Stocks To Bet On
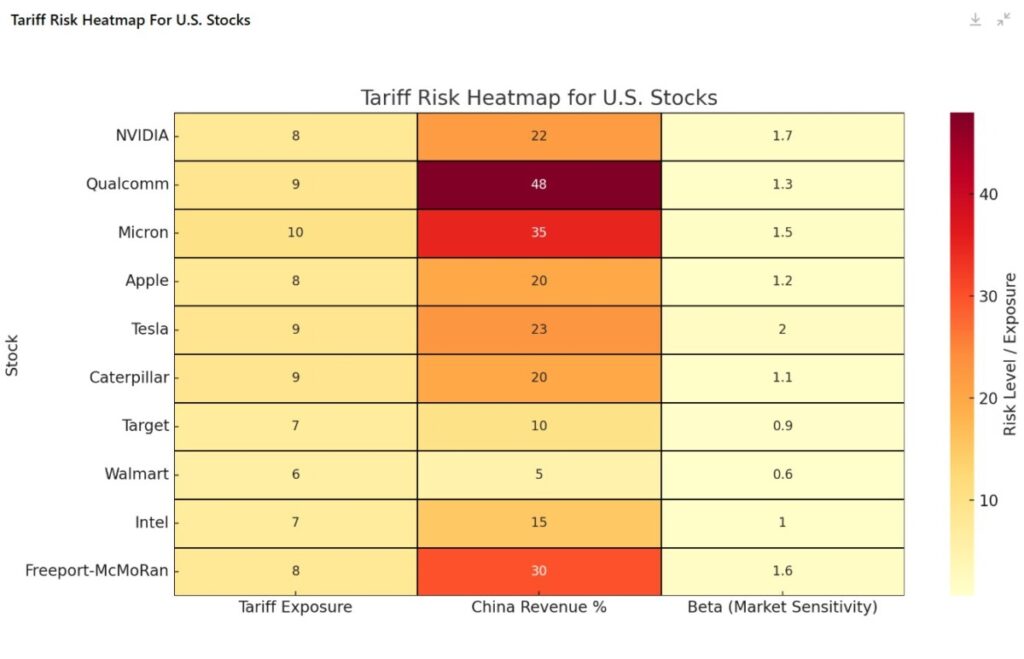
Here, you’ll want stocks that are sensitive to tariffs and also more volatile than the market.
For example, you might pick Nvidia (NVDA) and Micron (MU), based on the tariff risk heatmap above. Both of these stocks are likely to rise more than the market on a relief rally. They’re also likely to fall further than the market if we get another leg down (Disclosure, we are currently short Nvidia via options).
Check The Options Market For Both
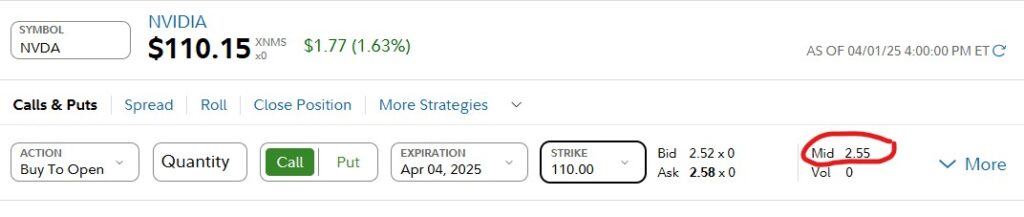
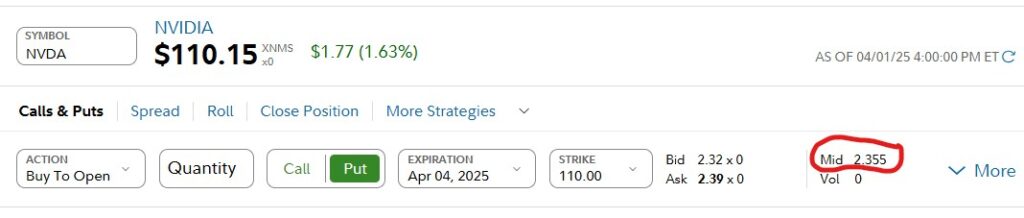
To get a feel for how much each stock might move by the end of the week, you can check the at the money straddle for options expiring on Friday. For Nvida, the midpoint of the spread on the at-the-money calls was $2.55 as of Tuesday’s close (screen captures via Fidelity).
And the midpoint of the spread of the ATM puts was $2.35.
So the options market was expecting a move of about $4.90 in either direction. Using the same approach, the options market was expecting about a $4 move in Micron in either direction.
Setting Up Your Trades
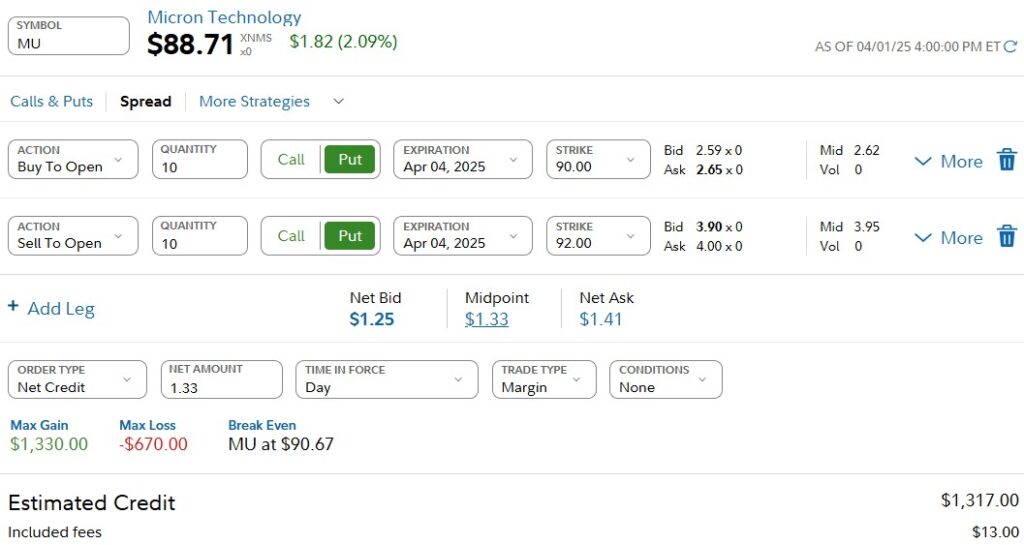
After repeating the process above in real time, you can place options spreads within the anticipated range of each stock. So, for example, a bullish bet on Micron might look like this: buying the $90 strike puts expiring on April 4th and selling the $92 strike puts expiring the same day, for a net credit of $1.33.
If the stock closes above $92 on Friday, you would make close to 200% on your trade, and if it closed below $90, you would lose 100%.
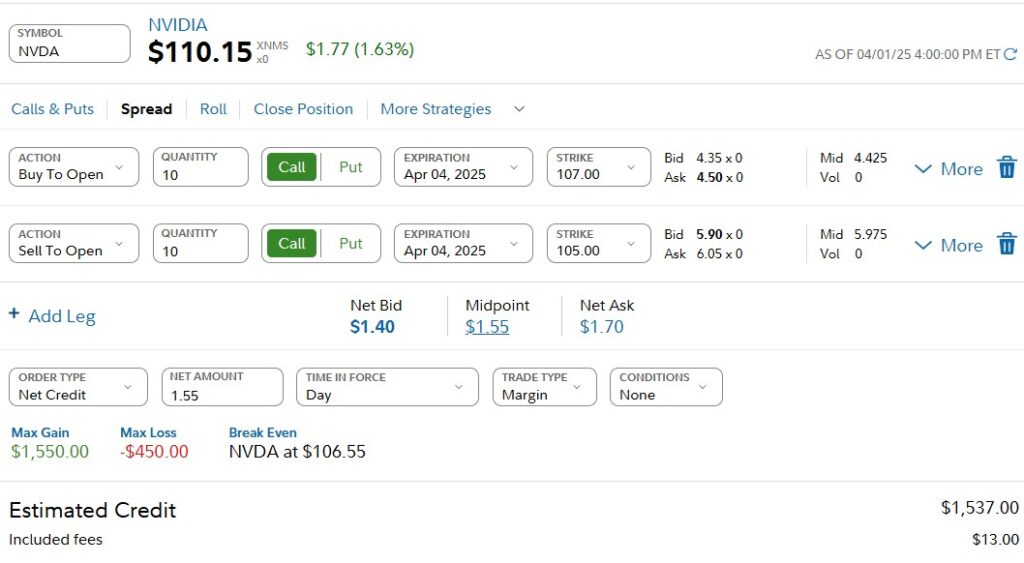
Here’s what a bearish bet on Nvidia might look like: Buying the $107 strike calls expiring on April 4th and selling the $105 strike calls expiring on the same day, for a net credit of $1.55.
With that trade, if NVDA closes below $105 on Friday, you could make close to 300%. If it closes above $107, you could lose 100%.
Making Money On Both Outcomes
As a reminder, the numbers above are all as of Tuesday’s close, so actual trades you place today might look a bit different. But for illustrative purposes, let’s say you get fills on both of these trades. Let’s consider what would happen in two scenarios.
We have a big relief rally. Nvidia and Micron both spike, and you make about 200% on your Micron trade and lose 100% on your Nvidia trade. Overall, you would have made money.
We get another leg down in the market. Nvidia and Micron both drop. You lose 100% on your Micron trade and make about 300% on your Nvidia. trade. Overall, you would have made money.
The outcome where you could lose money on both trades would be one where the market just stays flat.
Too Complicated? Just Want To Limit Your Risk?
If so, you might consider just hedging, if you haven’t done so already. You can download the Portfolio Armor optimal hedging app by aiming your iPhone camera at the QR code below (or by tapping here, if you’re reading this on your phone). Our app can help you find the least expensive hedges given your risk tolerance and time frame.
Want To Follow Our Trades Instead?
You can subscribe to our trading Substack/occasional email list below, and get a heads up next time we place one.
If you’d like to stay in touch
You can scan for optimal hedges for individual securities, find our current top ten names, and create hedged portfolios on our website. You can also follow Portfolio Armor on X here, or become a free subscriber to our trading Substack using the link below (we’re using that for our occasional emails now).
Pulled from Benzinga Pro data this sector movers alerts can help traders understand macro-level market trends. Traders often look for sector movers to provide high-level analysis on which sectors are over- or under-performing to make better investing decisions on exchange traded funds (ETFs) or individual tickers in those sectors.
Shares of video game developer, RobloxCorp (NYSE:RBLX) are trading higher on Tuesday after Rewarded Video Ads launch and partnership with Alphabet Inc (NASDAQ:GOOGL) owned Google.
The company is expanding its advertising capabilities through a new partnership with Google, allowing brands and agencies to programmatically purchase Rewarded Video ads within the gaming platform.
This move is part of Roblox’s broader effort to scale its immersive ad offerings and meet advertisers where they buy their media.
Initial trials of Rewarded Video ads have shown high user engagement, with average completion rates surpassing 80%. In certain experiences, completion rates have exceeded 90%, as players find value in earning in-game rewards for viewing brief video advertisements.
“This new format is a win-win-win for brands, creators, and users, and we’ve been excited by the early results of our tests which have proven this out,” said Vice President of Global Brand Partnerships and Advertising at Roblox, Stephanie Latham.
“Our partnership with Google makes it very easy to buy these engaging ads and reach key audiences at scale. We are continuing to remove barriers for brands and agencies that are quickly realizing the massive potential of immersive gaming platforms like Roblox where Gen Z are increasingly spending their time.”
Through this partnership, Google Ad Manager will be integrated into Roblox’s advertising technology stack, allowing advertisers to reach millions of daily active users, many of whom belong to Gen Z demographic.
This combination will benefit both advertisers and the Roblox creator community by expanding revenue opportunities. Game developers can incorporate Rewarded Video ads into their experiences, allowing them to earn money while offering players incentives like virtual currency or power-ups.
To ensure advertisers can assess the impact of their investments, Roblox is joining hands with measurement firms such as Cint, DoubleVerify, Integral Ad Science (IAS), Kantar, and Nielsen.
These partnerships will provide brands with data on media quality, brand suitability, brand lift, and audience engagement, helping them optimize their campaigns.
Roblox plans to expand its immersive ad formats, including Billboards, to Google Ad Manager in the coming months. It will also integrate more demand sources, such as top supply-side and demand-side platforms, through Google’s Authorized Buyers.
Price Action: RBLX shares traded higher by 2.16% at $59.55 at last check Tuesday.
Pulled from Benzinga Pro data this sector movers alert provides traders with a compiled way to read macro-level market trends. Investors garner a particular interest in sector movers to better determine sectors that are over- or under-performing to make better investing decisions on exchange-traded funds (ETFs) or individual tickers in those sectors.
Deep-pocketed investors have adopted a bearish approach towards Carvana (NYSE:CVNA), and it’s something market players shouldn’t ignore. Our tracking of public options records at Benzinga unveiled this significant move today. The identity of these investors remains unknown, but such a substantial move in CVNA usually suggests something big is about to happen.
We gleaned this information from our observations today when Benzinga’s options scanner highlighted 28 extraordinary options activities for Carvana. This level of activity is out of the ordinary.
The general mood among these heavyweight investors is divided, with 28% leaning bullish and 60% bearish. Among these notable options, 11 are puts, totaling $757,335, and 17 are calls, amounting to $1,076,506.
What’s The Price Target?
Based on the trading activity, it appears that the significant investors are aiming for a price territory stretching from $150.0 to $250.0 for Carvana over the recent three months.
Analyzing Volume & Open Interest
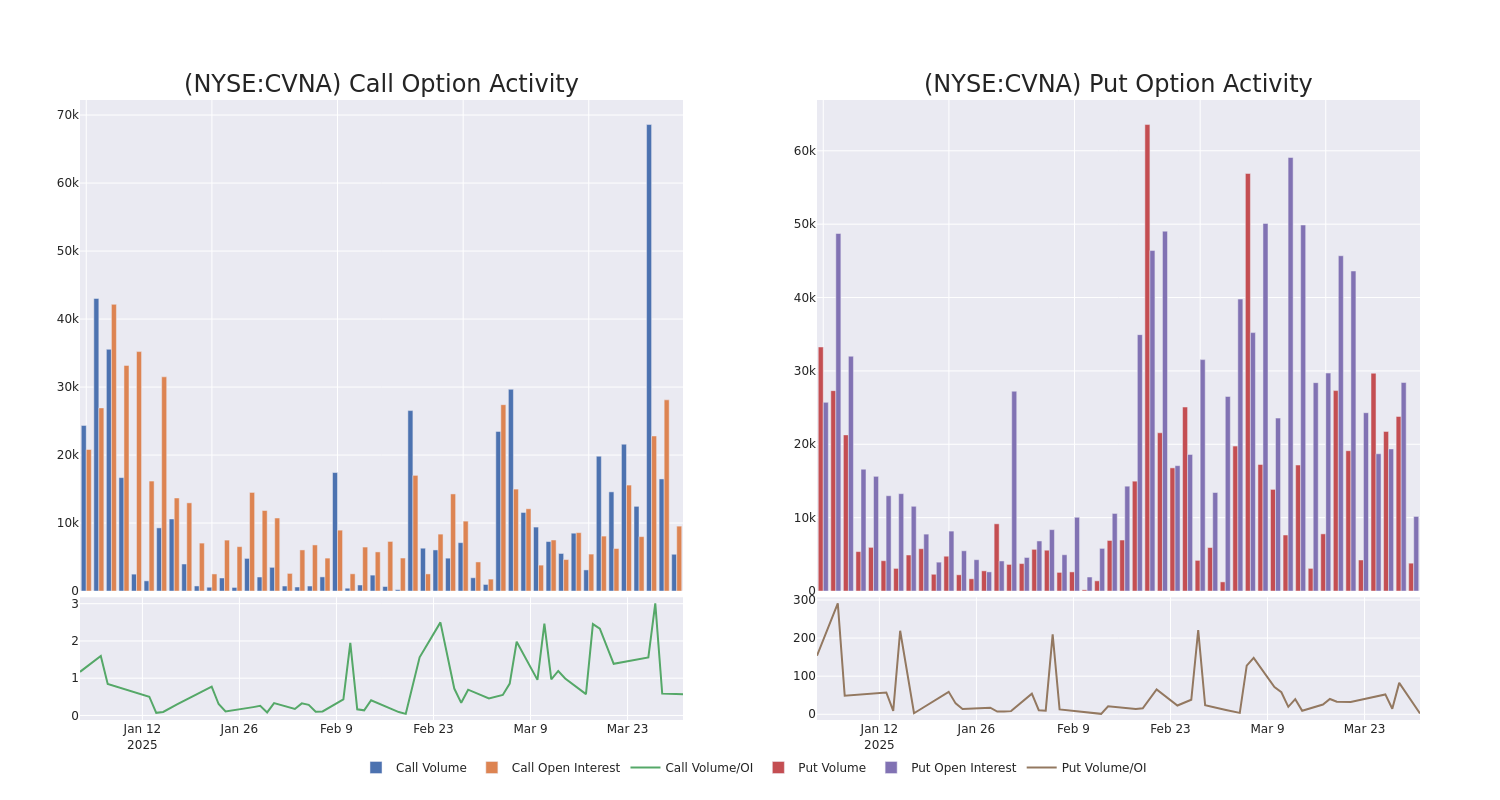
Examining the volume and open interest provides crucial insights into stock research. This information is key in gauging liquidity and interest levels for Carvana’s options at certain strike prices. Below, we present a snapshot of the trends in volume and open interest for calls and puts across Carvana’s significant trades, within a strike price range of $150.0 to $250.0, over the past month.
Carvana Option Volume And Open Interest Over Last 30 Days
Noteworthy Options Activity:
Symbol
PUT/CALL
Trade Type
Sentiment
Exp. Date
Ask
Bid
Price
Strike Price
Total Trade Price
Open Interest
Volume
CVNA
PUT
SWEEP
BEARISH
04/04/25
$3.3
$3.25
$3.3
$190.00
$222.0K
8.8K
1.5K
CVNA
CALL
SWEEP
NEUTRAL
04/04/25
$8.55
$8.4
$8.4
$205.00
$142.1K
276
1.0K
CVNA
PUT
SWEEP
BEARISH
04/11/25
$11.7
$11.4
$11.6
$200.00
$116.0K
492
117
CVNA
CALL
SWEEP
BEARISH
04/04/25
$8.0
$7.75
$8.0
$205.00
$112.8K
276
231
CVNA
CALL
TRADE
BULLISH
01/15/27
$102.0
$100.15
$102.0
$150.00
$102.0K
33
10
About Carvana
Carvana Co is an e-commerce platform for buying and selling used cars. The company derives revenue from used vehicle sales, wholesale vehicle sales and other sales and revenues. The other sales and revenues include sales of loans originated and sold in securitization transactions or to financing partners, commissions received on VSCs and sales of GAP waiver coverage. The foundation of the business is retail vehicle unit sales. This drives the majority of the revenue and allows the company to capture additional revenue streams associated with financing, VSCs, auto insurance and GAP waiver coverage, as well as trade-in vehicles.
Following our analysis of the options activities associated with Carvana, we pivot to a closer look at the company’s own performance.
Carvana’s Current Market Status
Currently trading with a volume of 1,134,339, the CVNA’s price is down by -0.35%, now at $203.69.
RSI readings suggest the stock is currently is currently neutral between overbought and oversold.
Anticipated earnings release is in 30 days.
Expert Opinions on Carvana
Over the past month, 5 industry analysts have shared their insights on this stock, proposing an average target price of $278.0.
Turn $1000 into $1270 in just 20 days?
20-year pro options trader reveals his one-line chart technique that shows when to buy and sell. Copy his trades, which have had averaged a 27% profit every 20 days. Click here for access.
* Consistent in their evaluation, an analyst from JP Morgan keeps a Overweight rating on Carvana with a target price of $365.
* In a positive move, an analyst from Piper Sandler has upgraded their rating to Overweight and adjusted the price target to $225.
* In a positive move, an analyst from Morgan Stanley has upgraded their rating to Overweight and adjusted the price target to $280.
* Consistent in their evaluation, an analyst from B of A Securities keeps a Buy rating on Carvana with a target price of $220.
* An analyst from Stephens & Co. downgraded its action to Overweight with a price target of $300.
Trading options involves greater risks but also offers the potential for higher profits. Savvy traders mitigate these risks through ongoing education, strategic trade adjustments, utilizing various indicators, and staying attuned to market dynamics. Keep up with the latest options trades for Carvana with Benzinga Pro for real-time alerts.
A meeting with the company’s CEO Ron Gusek and CFO Michael Stock highlighted management’s conviction in building the mobile power generation business “leveraging its partnerships and core competencies from its pressure pumping business,” according to JPMorgan.
The Liberty Energy Analyst: Analyst Arun Jayaram reaffirmed a Neutral rating and price target of $18.
The Liberty Energy Thesis: The company expects to take delivery of 150MW of power generation capacity by the end of 2025 and 250MW by the end of 2026, Jayaram said in a note.
“Management remains optimistic about the US shale industry’s long-term prospects, especially when considering rising demand from AI and data centers,” he wrote.
The analyst stated that Pricing pressures will likely continue to impact Liberty Energy’s margins in the first quarter. He lowered the EBITDA estimate from $167 million to $160 million, which is still higher than the Street’s expectations of $155 million.
“On a full-year basis, we expect overall EBITDA per fleet to decline to $19.5mm from $24.6mm in 2024 given frac pricing pressures,” Jayaram said. He added that EBITDA margins are likely to contract by 390 basis points to 17.5%.
LBRT Price Action: Shares of Liberty Energy had risen by 0.13% to $15.82 at the time of publication on Monday.